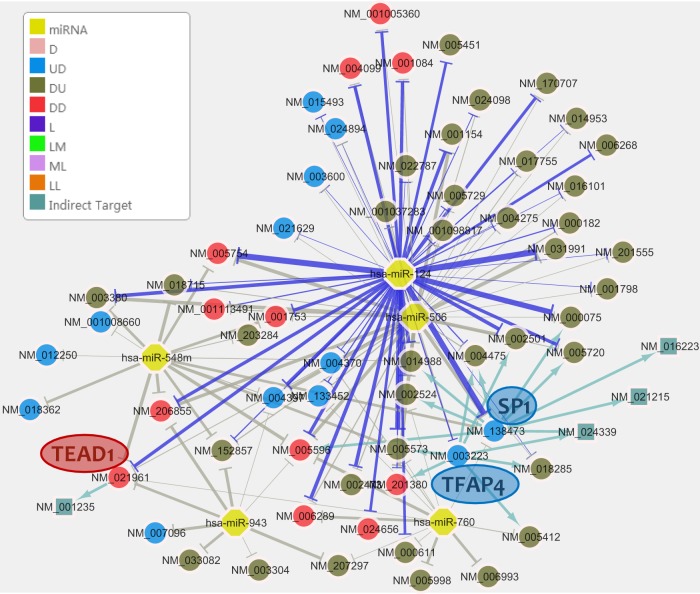
Fig. 2.
miRNA regulatory network with the top 5 enriched miRNAs in HeLa cells with miR-124 overexpression (p value < 1E-4). Each node is either an miRNA or a gene. Each edge is an arrow pointing from an miRNA to its target, indicating its suppressing role. The weights of the lines are proportional to the IS scores of the miRNA–target pairs. Purple lines: connection between an miRNA from the “Inputted miRNA” list and its targets. Gray lines: connection between other enriched miRNAs and their targets. Nodes in blue: genes in UD class having unchanged mRNA levels (U) but decreased protein levels (D). Nodes in green: genes in ML class having a medium expression level in mRNA (M) but a low expression level in protein (L). Nodes in pink: genes in D class having decreased expression in mRNA or protein when only mRNA or protein data are inputted, but not both.

