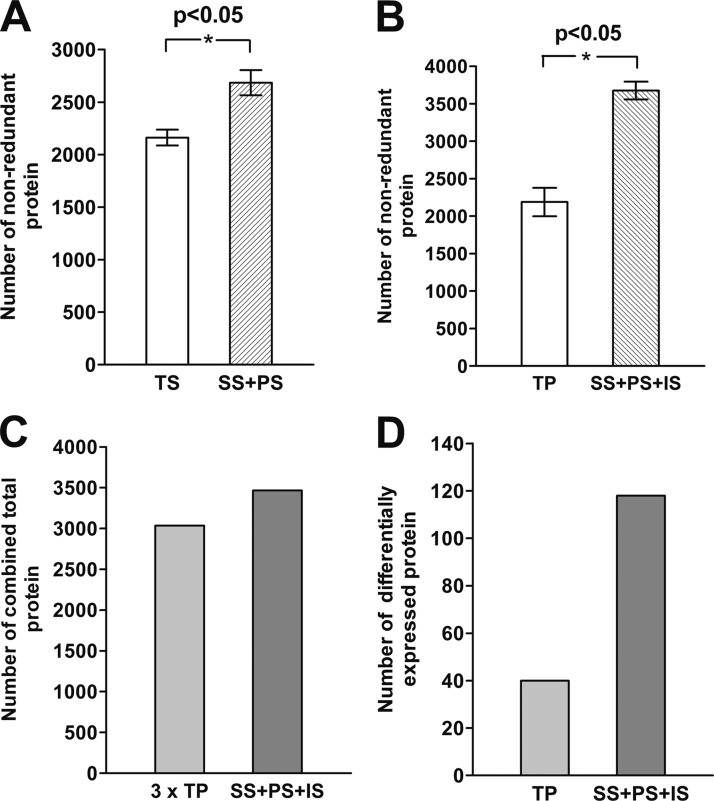
Fig. 4.
Improvement of protein identification and differential protein expression analysis. A, Comparison of the number of protein identified by TS and the combination of SS and PS. B, Comparison of the number of protein identification for TP and the combination of homogenizations, SS, PS, and IS. C, Comparison of total number of combined proteins between 3 independent TP biological samples and 1 biological samples of SS, PS, and IS. D, Comparison of the number of differentially expressed proteins identified in FAW larvae treated and untreated rice samples with the same fractionations of B. The standard errors were calculated based on duplicates of the biological samples from different factions.

