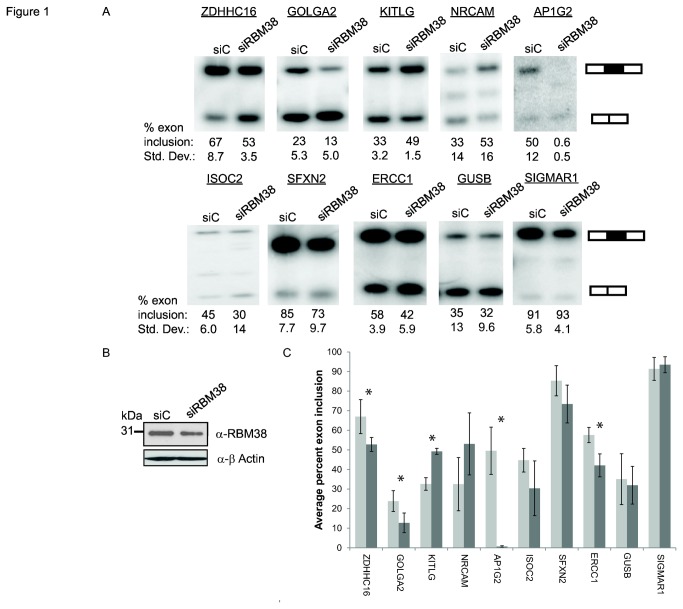
Figure 1. Validation of microarray predicted RBM38-regulated splicing events.
A) Semi-quantitative RT-PCR analysis of HJAY microarray targets in MCF-7 cells. Average percentages of exon inclusion with standard deviations compiled from three experiments are indicated below a representative gel. . For AP1G2, only two replicates were included in analyses. B) Western blot detection of siRNA knockdown of RBM38 in MCF-7 cell line (upper panel). Actin is shown as a loading control (lower panel). C) Bar graph representing data from panel A. siControl and siRBM38 treated cells are shown in light and dark gray bars, respectively (P-values of ≤ 0.05 are annotated with an asterisk).

