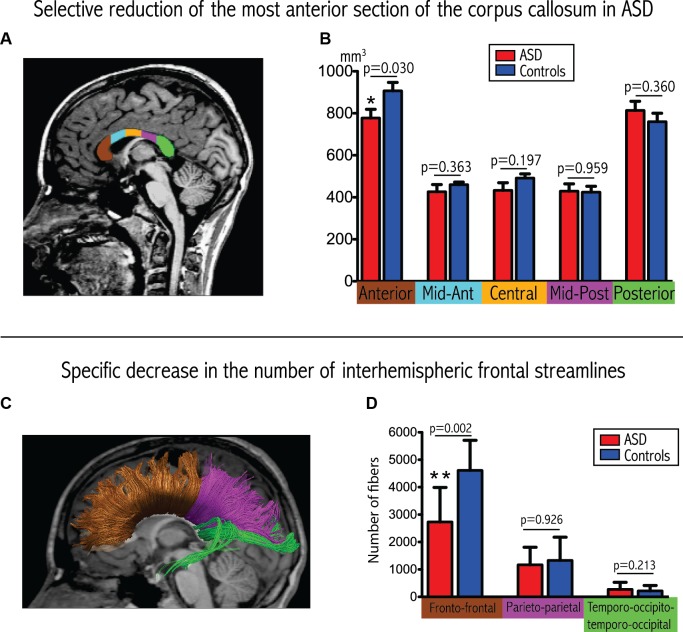
Figure 1.
Convergent evidence for disrupted connectivity at the level of inter-hemispheric frontal connectivity in ASD. (A) Example of subdivision of the five sections of the corpus callosum displayed on a mid-sagittal slice. (B) Boxplots depicting volumetric measurements for the five sections in the two groups. The p-values are extracted from the MANCOVA (with correction for age and gender). (C) Example of tractographic reconstruction where the inter-hemispheric fibers are subdivided into three groups according to the cortical regions that they connect. (D) Boxplots comparing the number of streamlines connecting homologous lobes. The p-values are extracted from the MANCOVA (correction for age, gender and total number of streamlines).

