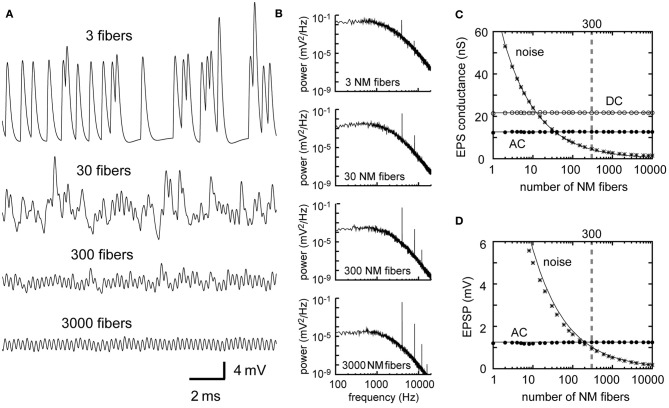
Figure 3.
Dependence of the synaptic input in NL on the number of presynaptic NM fibers. (A) Simulated traces of the model membrane potential. The number above each trace shows the numbers of NM fibers. The traces become less noisy as the number of NM fibers increases. (B) Power spectral densities of the four traces shown in (A). Low frequency noise components decrease with increasing numbers of NM fibers, while peaks at the input frequency and higher harmonics remain unchanged. Although the trace with 3 NM fibers (A, top) looks considerably different from the other three traces, its AC component (B, top) has the same amplitude as the other three. (C) Dependence of the DC, AC, and noise amplitudes of the simulated synaptic input on the number of NM fibers. (D) Dependence of the AC and noise amplitudes of the simulated membrane potential on the number of NM fibers. Solid lines in (C) and (D) are obtained from analytical calculations (Equations 1–5). Vertical broken gray lines in (C) and (D) show the default parameter (300 fibers) used in our simulations.

