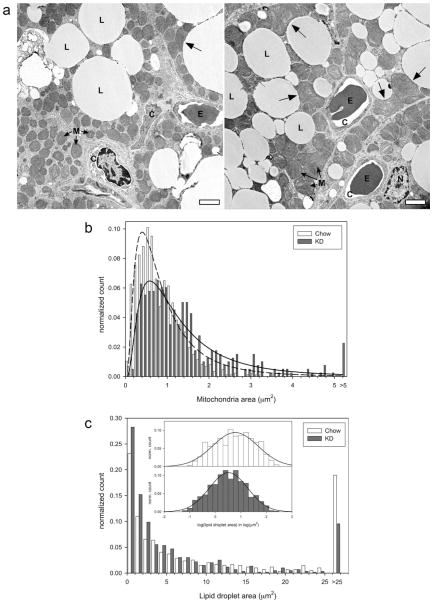
FIG 3.
IBAT TEM images and size distributions of mitochondria and lipid droplets. (a) Representative TEM images of IBATs from the Chow group (left panel) and the KD group (right panel). L, lipid droplet, C, capillary, M, mitochondria, E, erythrocyte, and N, nucleus. Unlabeled arrows indicate location of large, odd-shaped mitochondria associated with lipid droplets. Scale bar = 2 μm. Note the larger mitochondria and more number of smaller lipid droplets in the KD sample. (b) Distribution of mitochondrial sizes, (c) distribution of lipid droplet sizes. Inset shows normal distribution curve fitted to the logarithm of the lipid droplet size data.

