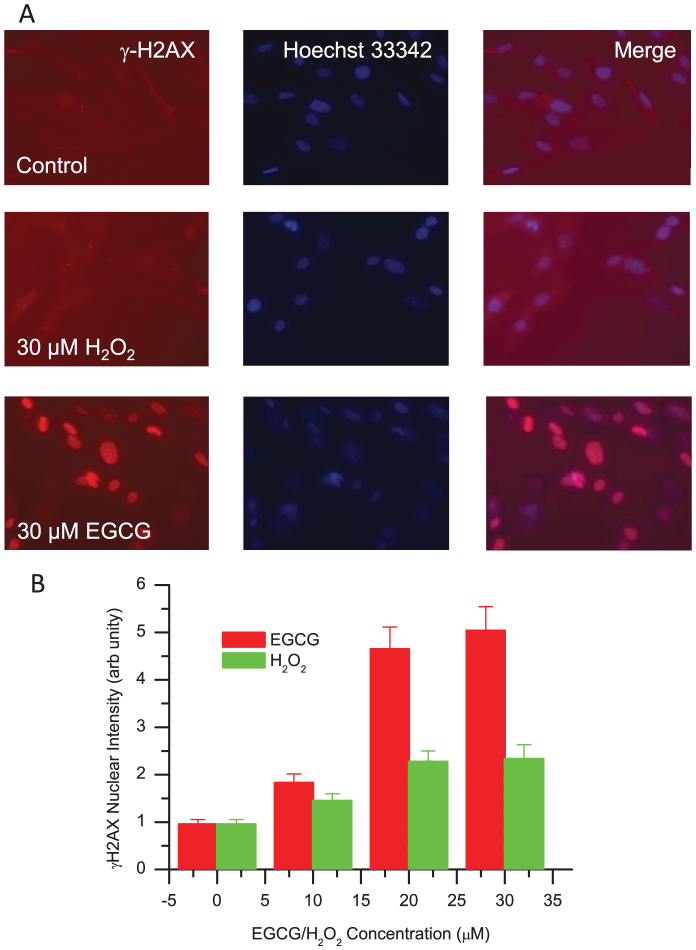
Figure 5. Imaging and analysis of genotoxicity of EGCG and H2O2 in MRC-5 cells using the HCS DNA Damage Kit.
MRC-5 cells were treated with various concentrations of EGCG/H2O2 for 12 hours at 37°C, 5% CO2. Images in (A) show that at the concentration of 30 μM, a large number of γ-H2AX foci were observed in the MRC-5 cells treated with EGCG, but not with H2O2; Hoechst 33342 was used to map nuclei. The graph (B) shows the γ-H2AX intensity in MRC-5 cells versus EGCG/H2O2 concentration, where quantitative analyses of activated γ-H2AX were performed using an Image J software.

