
Fig. 1.
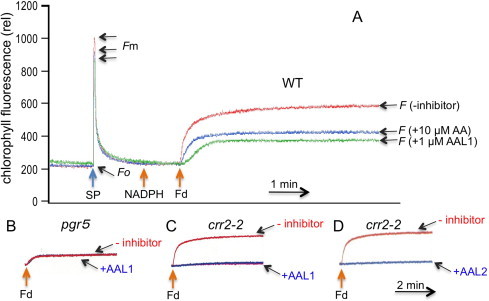
Screening of inhibitors using the Fd-dependent PQ reduction assay in ruptured chloroplasts. (A) An example of screening. PQ reduction was monitored as the chlorophyll fluorescence increased, and fluorescence levels were normalized against Fo levels. Fv/Fm values depended on the chloroplast preparation and were in the range of 0.7–0.8; this level of difference was unlikely to significantly affect the (F − Fo)/(Fm − Fo) values. This figure shows representative fluorescence patterns of wild-type, ruptured chloroplasts that were exposed to 10 μM AA, 1 μM AAL1, or no inhibitor, and the timings of addition of NADPH and Fd are indicated. “SP” indicates the saturation pulse for monitoring Fm, and the levels of Fo, Fm, and F are indicated. (B) The effect of 1 μM AAL1 on Fd-dependent PQ reduction in pgr5. (C and D) The effect of 1 μM AAL1 (C) and 1 μM AAL2 (D) on Fd-dependent PQ reduction in crr2–2.