
Fig. 3.
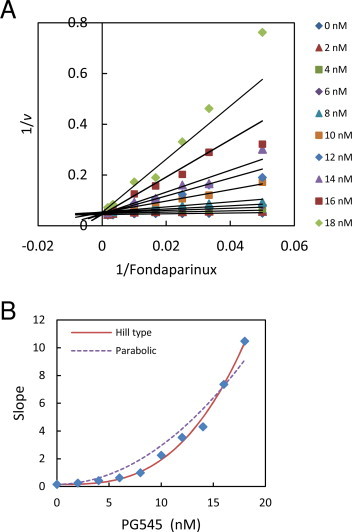
Double reciprocal analysis of PG545 inhibition of heparanase (panel A). Fondaparinux assays conducted as per Section 2. Data are means of 2 measurements. Lines were generated from the apparent Km and Vmax values. The slopes from panel A were replotted as a function of PG545 concentration in panel B. The solid line in panel B is the fit of Eq. (4) to the data (R2 = 0.993, SS = 0.735) and the dotted line is the fit of Eq. (2) (R2 = 0.950, SS = 5.450) for comparison.