

Abstract
Megakaryoblastic leukemia 1 (MKL1) is a member of the MKL family of serum response factor (SRF) coactivators. Here we have identified three rat MKL1 transcripts: two are homologues of mouse MKL1 transcripts, full-length MKL1 (FLMKL1) and basic, SAP, and coiled-coil domains (BSAC), the third is a novel transcript, MKL1-elongated derivative of yield (MELODY). These rat MKL1 transcripts are differentially expressed in a wide variety of tissues with highest levels in testis and brain. During brain development, these transcripts display differential patterns of expression. The FLMKL1 transcript encodes two isoforms that utilize distinct translation start sites. The longer form possesses three actin-binding RPXXXEL (RPEL) motifs and the shorter form, MKL1met only has two RPEL motifs. All four rat MKL1 isoforms, FLMKL1, BSAC, MKL1met and MELODY increased SRF-mediated transcription, but not CREB-mediated transcription. Accordingly, the differential expression of MKL1 isoforms may help fine-tune gene expression during brain development.
Keywords: Megakaryoblastic leukemia, Serum response factor, Transcript, Alternative promoter, Transcriptional coactivator
Abbreviations: BSAC, basic, SAP, and coiled-coil domains; DAPI, 4′, 6-diamidino-2-phenylindole; GFP, green fluorescent protein; MAL, megakaryocytic acute leukemia; MKL1, megakaryoblastic leukemia 1; MELODY, MKL1-elongated derivative of yield; RPEL, arginine proline XXX glutamate leucine; SRF, serum response factor
Highlights
-
•
Megakaryoblastic leukemia 1 (MKL1) is a serum response factor (SRF) coactivator.
-
•
We have identified multiple rat MKL1 isoforms, including a novel one named MELODY.
-
•
Rat MKL1 isoforms are enriched in testis and brain.
-
•
Expression of rat MKL1 isoforms is regulated during brain development.
-
•
All rat MKL1 isoforms act as SRF transcriptional coactivators.
1. Introduction
The megakaryoblastic leukemia (MKL) family members, MKL1 and MKL2, function as serum response factor (SRF) coactivators [1–5]. Several studies conducted in non-neuronal cells have shown that MKL1 binds to G-actin via its RPXXXEL (RPEL) motifs and translocates into the nucleus where it binds to and activates SRF in response to actin polymerization and G-actin depletion [6–8]. MKL1 and MKL2 regulate a set of genes that code for cytoskeletal proteins and are involved in alteration of cell shape and motility [5]. MKL family members are also highly expressed in the brain and they regulate morphology of cultured cortical or hippocampal neurons [9–12].
MKL1 isoforms were initially identified in non-neuronal cells. One of the mouse MKL1 cDNAs derived from NIH3T3 cells has two alternative translation start sites; the upstream site uses leucine as the initiator codon and generates full-length MAL/MKL1, MAL/MKL1(fl), while the downstream site employs methionine as the start codon to produce a shorter protein, MAL/MKL1(met) [6]. Another MAL/MKL1 transcript, called BSAC (basic, SAP and coiled-coil domain) has been identified in mouse spleen which contains a 5′-exon different from that of the MAL/MKL1(fl) transcript [2]. Mouse MAL/MKL1 (fl) and MAL/MKL1met are able to translocate from the cytoplasm to the nucleus in response to serum-stimulation in NIH3T3 cells [6]. As MKL1 is expressed prominently in brain and plays a key role in regulating neuronal morphology, we sought to define the pattern of expression of MKL1 transcripts during brain development and whether MKL1 isoforms differ in their ability to regulate SRF-mediated transcription. In the course of these studies, we have identified a novel MKL1 transcript termed MKL1-elongated derivative of yield (MELODY) and two MKL1 transcripts which have homology to mouse MAL/MKL1(fl) and BSAC. Furthermore, we have found that: (1) these MKL1 isoforms are differentially expressed during brain development, and (2) MELODY, in addition to FLMKL1, BSAC and MKL1met, activates SRF-mediated transcription.
2. Materials and methods
2.1. Animals
Male SD rats for measuring MKL1 mRNA expression were purchased from Sankyo Labo Service Corporation, Inc. (Tokyo, Japan). All experiments were carried out in accordance with the guidelines of the Animal Care and Experimentation Committee of University of Toyama, Sugitani Campus. The protocols were approved as permit numbers (S-2008 PHA-3, S2009 PHA-23, S2010 PHA-1, A2011 PHA-5, A2012 PHA-1). Every effort was made to minimize suffering.
2.2. Cloning of rat MKL1 transcripts
To clone cDNA of rat MKL1 transcripts, the following primers for 5′-rapid amplification cDNA-end (5′-RACE) were initially designed based on the predicted rat MKL1 mRNA sequence (NCBI Reference Sequence: XM_235497.4), which was derived by sequence tagged sites (STS) and expressed sequence tags (EST). The primers correspond to the predicted exons 7 and 8: RT (5′-TCTCATTGAGGTC-3′), sense1 (5′-GAGCCTTCTCTCCAGGCCAA-3′), antisense1 (5′-AGGTCTCTTCCAGAATGTGC-3′), sense2 (5′-GCTGAAGCTGAAGAGAGCCA-3′), antisense2 (5′-CCTGACCAGCTCTGATCTCT-3′). The 5′-RACE procedure was performed by PCR with Pfu DNA polymerase (Promega, Madison, WI, USA), followed by reverse transcription, degradation of RNA, and circularization with 5′-Full RACE Core Set (TaKaRa, Shiga, Japan) in the reaction mixture containing SD rat adult hippocampal RNA. Sequence analysis of the 5′-RACE products revealed that two different 5′-ends were present that are homologous to mouse full length MKL1 and BSAC, respectively. These two fragments were tentatively termed full-length MKL1 (FLMKL1) and basic, SAP and coiled-coil domain (BSAC), respectively. The predicted 1st and 2nd exons were absent in FLMKL1. Thus, the 5′-RACE was further performed with AmpliTaq Gold (Applied Biosystems, Carlsbad, CA, USA), 5′-Full RACE Core Set and primers (RT2: 5′-CCGCTCACTAAGTG-3′; sense3: 5′-GAACTGCAGGAGCTGTCCCT-3′; antisense3: 5′-TTGGCAACAGCTTCGCTCTG-3′; sense4: 5′-TGACTCTGGGCCTCCATCCT-3′; antisense4: 5′-CAGAGACAGGAGCACCGGTT-3′) corresponding to the predicted exon 3. The 5′-RACE product possesses a newly identified 5′-exon and was tentatively named MKL1-elongated derivative of yield (MELODY). To obtain FLMKL1, BSAC and MELODY cDNA including their coding regions, PCR was carried out with rat 7-week hippocampal cDNA as a template, PrimeSTAR Max DNA polymerase (TaKaRa), sense primers (5′-CGGTACCCGGGGATCCTCGCTAGCCACGCTCCCTC-3′ for FLMKL1; 5′-CGGTACCCGGGGATCGCTGGGCTTCCTGTCTGCAC-3′ for BSAC; 5′-CGGTACCCGGGGATCGCAGAGACACCTGTCAGGAC-3′ for MELODY) and antisense primer (5′-CGACTCTAGAGGATCGCCTCTAGGGACTGTGATTGTC-3′ for a common 3′-untranslated region). The sequence analyses of FLMKL1 (DDBJ Accession No. AB588919), BSAC (AB588920) and MELODY (AB588921) were deposited.
2.3. Search of transcription factor-binding sites within rat MKL1 genome
To find transcription factor-binding sites upstream of transcription start site of rat MKL1 isoforms, we used the TF search program (http://mbs.cbrc.jp/research/db/TFSEARCH.html), which is directly owned to the TRANSFAC databases developed at GBF-Braunschweig, Germany [13]. Rat MKL1 genome sequences, shown in the website of Ensembl database (http://www.ensembl.org/index.html), was used for TF search program. One kilobase long upstream of 5′-ends of FLMKL1, MELODY, BSAC were searched at threshold score = 95.0.
2.4. RNA isolation and real-time quantitative PCR
Total RNA was extracted from rat tissues and brain regions using TRIsure (Bioline). Then, RNA was treated with DNase I and further purified using TRIsure again. Using the RNA solution, cDNA was synthesized with SuperScriptII reverse transcriptase (Invitrogen, Carlsbad, CA, USA). In brief, for detection of FLMKL1, BSAC, and MELODY mRNA levels, the PCR was performed in 20 μL of 1× SYBR system using SYBR Green PCR master mix (Applied Biosystems, Foster City, CA, USA) containing 2 μL of cDNA solution and 0.4 μM primers (5′-TCCTTGAGGCTCGGGAGGATA-3′ and 5′-GTCCAGCCCATTCACAGCAATG-3′ for FLMKL1; 5′-GCTTCCTGTCTGCACTCACTC-3′ and 5′-GACGGAGTCCTCACGGAAAC-3′ for BSAC; 5′-CAGAGACACCTGTCAGGACG-3′ and 5′- GTCCAGCCCATTCACAGCAATG-3′ for MELODY). After preheating at 95 °C for 10 min, the samples were denatured at 95 °C for 45 s, annealed at 60 °C for 45 s, and extended at 72 °C for 1 min for 45 cycles. Quantification of each transcript was calculated by the following procedure. In brief, the initial cDNA copy number [DNA0], which reflects mRNA expression of the sample, was calculated from PCR-amplified cDNA copy number [DNA], Ct value (c), amplification efficiency (e) and cDNA standard curve. The formula, [DNA] = [DNA0](1 + e)c, was used for calculation.
2.5. Plasmids and antibodies
To generate a series of FLAG-tagged rat MKL1 constructs (FLAG-FLMKL1, FLAG-BSAC, FLAG-MELODY and FLAG-MKL1met), the coding regions of FLMKL1 (from 5′-CCCCCTTCCGTCATT-3′ to 5′-TGGGATTCCTGCTTG-3′), BSAC (from 5′-ACTCTGCTGGAGCCT-3′ to 5′-TGGGATTCCTGCTTG-3′), MELODY (from 5′-GGAGGGGTTACCATC-3′ to 5′-TGGGATTCCTGCTTG-3′) and MKL1met (from 5′-CCGCCTTTGAAAAGT-3′ to 5′-TGGGATTCCTGCTTG-3′) were linked to the downstream (5′-CTTGCGGCCGCGAATTCA-3′) of the FLAG tag sequence of pFLAG-CMV2 vector (SIGMA, St. Louis, MO, USA). The expression vector for enhanced green fluorescent protein (pEGFP-C1) was purchased from Clontech. The SRF reporter vector, 3D.ALuc, generously provided by Dr. R. Treisman (Cancer Research Institute, London, UK) has been described previously [6,9,11]. The CRE-reporter vector, pCRE-Luc (CRE-Luc), and the SRE-reporter vector, pSRE-Luc (SRE-Luc), were purchased from Stratagene (La Jolla, CA, USA). An internal control vector, TK-Renilla vector, has been described previously [9]. The following antibodies were used: anti-green fluorescent protein (GFP) made in rabbit (Invitrogen or Medical & Biological Laboratories; 1:500 or 1:1000), anti-FLAG (SIGMA; 1:1000) made in mouse, and anti-α-tubulin (SIGMA; 1:1000) made in mouse.
2.6. Cell culture
NIH3T3 cells were cultured in Dulbecco's modified Eagle medium (DMEM; Invitrogen) containing 10% fetal bovine serum (Invitrogen), 10% Nu-serum (BD Biosciences, San Jose, CA, USA), 2 mM glutamine (Invitrogen), 1% penicillin/streptomycin (Invitrogen), as described previously [9]. For reporter assays, cells were seeded at 5 × 10⁵ cells/well and grown on six-well plates (Nalge Nunc, Naperville, IL, USA).
2.7. Transfection into NIH3T3 cells
Transfection into NIH3T3 cells was performed using lipofectamine (Invitrogen) and Plus reagent (Invitrogen) as described previously [9]. Medium exchange was carried out 4 h after transfection. Cell lysates were prepared 20 h after transfection.
2.8. Western blotting
In order to measure the expression levels of FLAG-tagged rat MKL1 variants, we performed Western blotting for the FLAG tag (Fig. 4A). Protein was extracted in the whole cell extract buffer containing 25 mM HEPES, 0.3 M NaCl, 1.5 mM MgCl2, 0.2 mM EDTA, 0.1% Triton X-100, 20 mM β-glycerophosphate, 10 μg/mL aprotinin, 10 μg/mL leupeptin, 1 mM sodium orthovanadate, 1 mM dithiothreitol, and 1 mM phenylmethylsulfonyl fluoride. After centrifugation, the cell lysates were mixed with an equal volume of 2× Laemmli sample buffer (Bio-Rad Laboratories, Hercules, CA, USA) and subjected to sodium dodecyl sulfate–polyacrylamide gel electrophoresis. Protein detection was carried out with the enhanced chemiluminescence (ECL) protocol (GE Healthcare, Little Chalfont, UK).
Fig. 4.
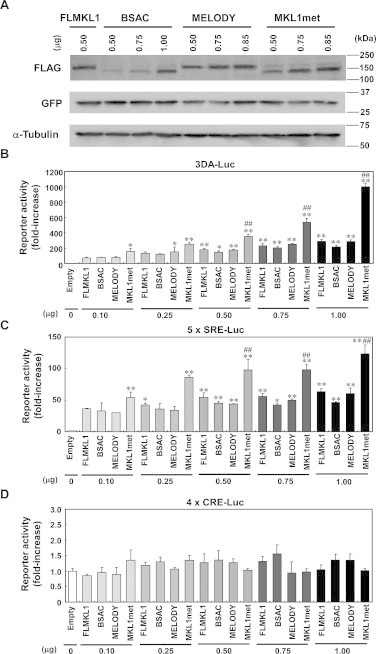
Effects of MKL1 isoforms on SRF- and CREB-mediated transcriptional responses in NIH3T3 cells. (A) The expression level of FLAG-tagged MKL1 variants. FLAG-tagged FLMKL1, BSAC, MELODY or MKL1met (the amount indicated as 0.50–1.00) was co-transfected with GFP vector (1 μg/well) into NIH3T3 cells. Twenty-four hours later, cell lysates were collected and Western blotting was performed. In transfection studies presented in this and subsequent figures, empty vector was added as needed to keep the total amount of expression vectors used for transfection per well constant. (B–D) Either 1.0 μg/well of empty vector (Empty), 0.1, 0.25, 0.5, 0.75 and 1.0 μg/well of FLAG-tagged FLMKL1, BSAC, MELODY or MKL1met was co-transfected with firefly luciferase vector (B: 3D.A.Luc, C: 5× SRE-Luc, D: 4× CRE-Luc, 1.0 μg/well) and Renilla luciferase reporter vectors, TK-Renilla (0.2 μg/well) into NIH3T3 cells. Twenty-four hours later, luciferase activities were measured. To keep the total amount of transfected vector constant (2 μg total/well), empty vector was added as needed. Bar graphs represent the means ± SD from at least three samples. *p < 0.05 (vs. empty), **p < 0.01 (vs. empty), ***p < 0.001 (vs. empty), ##p < 0.01 (vs. FLMKL1).
2.9. Reporter assay
Transcriptional activity was monitored using either the firefly luciferase or Renilla luciferase activity as described previously [9]. Luciferase activity was monitored using dual luciferase assays according to the manufacturer's instructions (Promega).
2.10. Statistical analysis
Statistical significance of treatment effects was analyzed by ANOVA.
3. Results
3.1. Identification of rat MKL1 transcripts
To identify rat MKL1 transcripts, we first designed primers for 5′-rapid amplification cDNA-end (5′-RACE) based on the predicted rat MKL1 mRNA sequence (NCBI Reference Sequence: XM_235497.4) (Fig. 1A, on the top). Sequence analysis of the 5′-RACE products generated from primers located in predicted exons 7 and 8 revealed that two different 5′-ends were present that were homologous to mouse full length MAL/MKL1 and BSAC. However, since the predicted exons 1 and 2, which were provided by NCBI reference sequence, were absent from the presumed 5′ fragment of rat FLMKL1, we performed another round of 5′-RACE with primers corresponding to the predicted exon 3. Although these 5′-RACE products still did not contain sequences corresponding to either of the predicted exons 1 and 2, which were provided by NCBI reference sequence, they did contain a transcript with a novel 5′ exon that we refer to as MELODY (MKL1-elongated derivative of yield). Subsequent cloning and sequence analysis of the entire FLMKL1 (DDBJ: AB588919), BSAC (DDBJ: AB588920) and MELODY (DDBJ: AB588921) cDNAs revealed that the predicted 1st and 2nd exons were absent from all three rat MKL1 cDNA obtained in this study (Fig. 1A). Each of the three rat MKL1 transcripts identified have distinct 5′-exons, implying that alternative promoters may be located upstream of each of these 5′-exons. To find transcription factor-binding sites of rat MKL1 gene, we used TF search [13]. Binding sites of ETS, AML-1a are located within 1 kbp upstream of 5′ ends of FLMKL1. Binding sites of SRY, CdxA, Nkx-2 are located within 1 kbp upstream of 5′ ends of MELODY. SRY, CdxA are located within 1 kbp upstream of 5′ ends of BSAC cDNA. These binding sites may be involved in differential regulation of MKL1 isoform transcription.
Fig. 1.
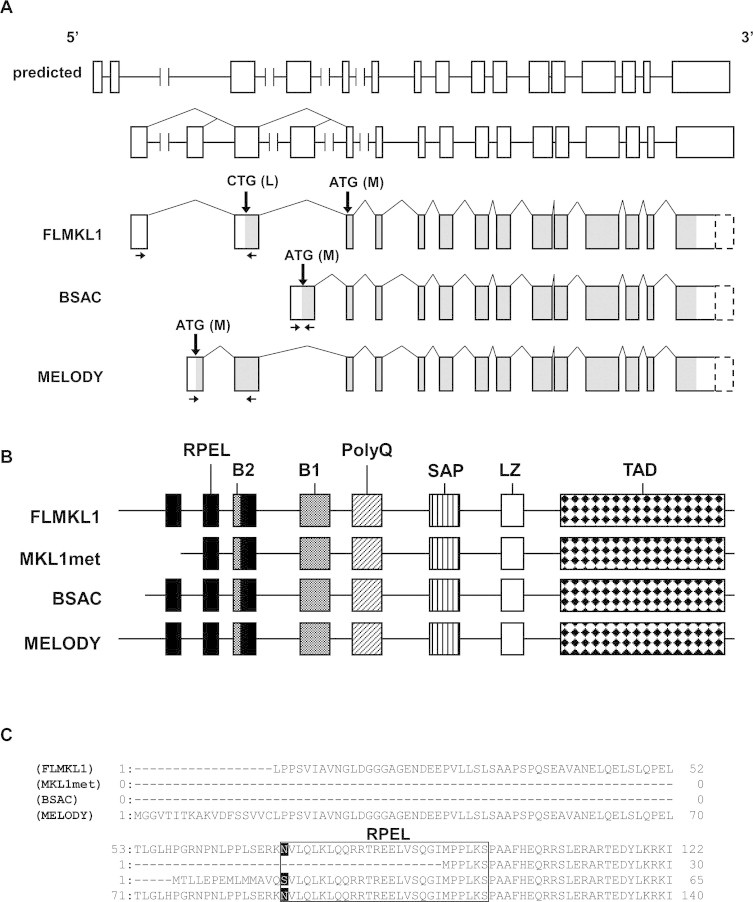
Deduced exon–intron organization and domain structure of rat MKL1 isoforms. (A) Deduced exon–intron organization. Boxes indicate exons. Sizes of exons and introns are depicted approximately to scale. The predicted exon locations (on the top) are illustrated in accordance with the NCBI's information (NCBI Reference Sequence: XM_235497.4 and NW_047780.1). The exon (open boxes)–intron organization (the second from the top) is illustrated based on the sequence data shown in this study. The last three structures indicate the deduced exon–intron organization of FLMKL1, BSAC and MELODY variants, respectively. Shaded regions indicate the open reading frames. Boxes drawn by broken lines indicate the predicted 3′-untranslated regions, which were not analyzed in this study. Thick arrows indicate the putative initiation codons. Thin arrows indicate the location of primers used for real-time quantitative PCR measurements of each mRNA transcript. The FLMKL1 possesses two putative initiation codons, possibly giving rise to two different proteins, FLMKL1 and MKL1met, respectively (also shown in Fig. 1B). (B) Conserved motifs of FLMKL1, MKL1met, BSAC and MELODY. The illustrated domains were predicted on the basis of Pfam (http://www.sanger.ac.uk/). FLMKL1 and MKL1met can be produced by the distinct usage of two initiation codons, CTG and ATG, in a common transcript, respectively (see (A)). RPEL: arginine proline XXX glutamate leucine; B1 and B2: basic regions 1 and 2; PolyQ: polyglutamine repeat; SAP: SAF-A/B, Acinus and PIAS; LZ: leucine zipper; TAD: transcriptional activation domain. (C) Variation of the N-termini of FLMKL1, MKL1met, BSAC and MELODY. The numbers at both ends indicate the amino acid position of each isoform. The rectangle indicates the first RPEL motif. The first amino acids of the RPEL motif are written in white.
The study by Miralles et al. demonstrated that mouse FLMKL1 contains two alternative translation start sites [6]. The two translation products generated, FLMKL1 and MKL1met, possess three and two RPEL motifs, respectively (Fig. 1B, on the top and the second rows). Although the junction between the distinct 5′ exon located in BSAC and the first exon shared in common by all the transcripts is located at the N-terminal border of the first RPEL domain, we noted that amino acid sequences of this domain is identical in BSAC, FLMKL1 and MELODY, except for the very first amino acid residue which is switched to serine in BSAC instead of asparagine present in FLMKL1 and MELODY (Fig. 1C). The nucleotide and amino acid sequences of rat MKL1 transcripts identified here are summarized in supporting information figures available online (Figs. S1, S2 and S3). In comparing these cDNA nucleotide sequences with the corresponding rat genomic sequence (NCBI Reference Sequence: NW_047780.1 and NW_001084859.1), we noted a discrepancy in one nucleotide (the 2816th base in FLMKL1 (DDBJ: AB588919), the 2671st base in BSAC (DDBJ: AB588920) and the 2798th base in MELODY (DDBJ: AB588921) (Figs. S1, S2 and S3). All three cDNA sequences contain T residues rather than a C residue reported in the genomic database, a substitution that would result in a switch from serine to leucine. It is still unknown whether or not this conversion is due to RNA editing or a single nucleotide polymorphism.
3.2. Tissue-distribution of rat MKL1 transcripts
We next examined the tissue-distribution of FLMKL1, BSAC, and MELODY mRNAs. Specific primers were designed for the detection of FLMKL1, BSAC and MELODY expression as shown in Fig. 1A (arrows). Initially, we confirmed whether quantitative PCR analysis could detect the mRNA expression of each transcript specifically. No PCR-amplification was observed in the reverse transcription-free samples (Fig. S4, control−), but bands appeared when each transcript-carrying plasmid template (Fig. S4, control+) or reverse transcribed samples (Fig. S4, 14 kinds of tissues) were used. This showed that PCR products were derived from cDNA, but not from contamination with genomic DNA. Furthermore, only one band was generated in each assay and it had the predicted size, suggesting that the quantitative PCR analysis specifically detected only one amplified band of interest, but not non-specific bands. Two initiator codons of FLMKL1 give rise to two translation products, FLMKL1 and MKL1met. Therefore, the PCR products amplified with primers for FLMKL1 included both FLMKL1 and MKL1met. Quantitative real-time PCR revealed that all MKL1 transcripts were enriched in the nervous system (Fig. 2) and that the level of MELODY mRNA was very low compared to other transcripts (Fig. 2C). As expression of MELODY is orders of magnitude below that of FLMKL1 and BSAC, its impact on cell signaling is unclear. The expression of FLMKL1 and MELODY was relatively high in the testis and the olfactory bulb (Fig. 2A and C). BSAC was enriched in the hippocampus (Fig. 2B).
Fig. 2.
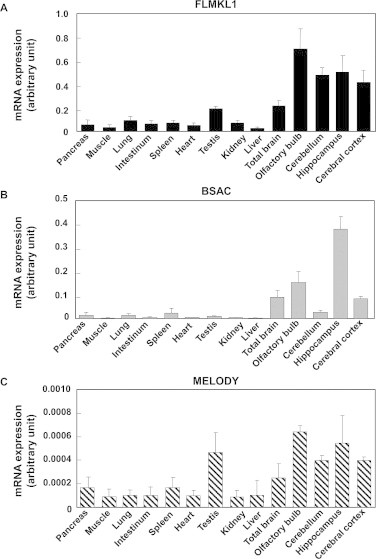
Regional expression of rat MKL1 transcripts in adult tissues. Complementary DNA derived from several tissues of 7-week old rat (pancreas, muscle, lung, intestinum, spleen, heart, testis, kidney, liver, total brain, olfactory bulb, cerebellum, hippocampus and cerebral cortex) was subjected to real-time quantitative PCR analysis with FLMKL1 (A), BSAC (B), MELODY (C) specific primers. Primer positions are illustrated in Fig. 1A. Data represent the means ± SD from at least three independent experiments.
3.3. Developmental regulation of rat MKL1 transcripts in the brain
As the tissue survey described above showed that MKL1 mRNA was highly expressed in the brain (Fig. 2), we proceeded to determine the expression profile of MKL1 transcripts during brain development. Using quantitative PCR analysis of cDNAs derived from several brain regions at different developmental stages, we found that BSAC was the most abundant of the three MKL1 transcripts during brain development (Fig. 3). The expression level of BSAC mRNA increased after P10–P15 in both the hippocampus and the cerebral cortex (Fig. 3H and K). In contrast, MELODY mRNA level decreased during development in several brain regions (Fig. 3C, I, L and O). The expression pattern of FLMKL1 mRNA during development varied across different regions (Fig. 3A, D, G, J and M). In combination, these data show that the pattern of expression of the alternative transcripts generated from the rat MKL1 gene is dynamically regulated during brain development.
Fig. 3.
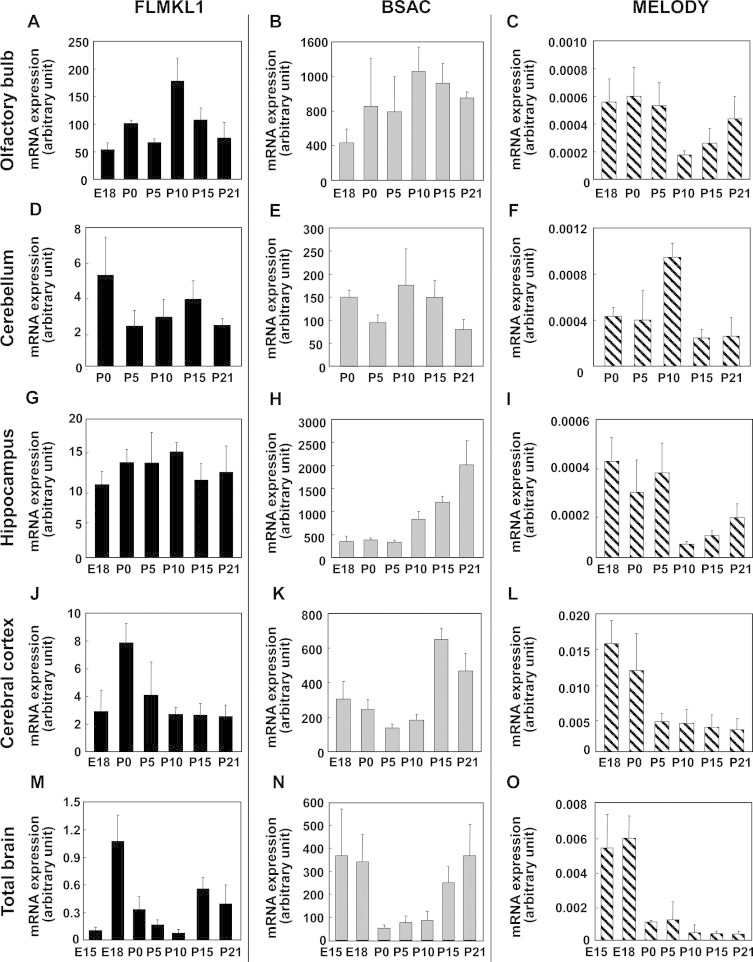
Differential expression of rat MKL1 transcripts in the developing brain. Samples were prepared from the olfactory bulb (A–C), cerebellum (D–F), hippocampus (G–I), cerebral cortex (J–L) and total brain (M–O) and subjected to real-time quantitative PCR analysis with FLMKL1 (A, D, G, J and M), BSAC (B, E, H, K and N) and MELODY (C, F, I, L and O) specific primers. E15, embryonic day 15; E18, embryonic day 18; P0, post-natal day 0 (day of birth); P5, post-natal day 5; P10, post-natal day 10; P15, post-natal day 15, P21; post-natal day 21. Bar graphs represent the means ± SD from at least three independent experiments.
3.4. SRF coactivator function of rat MKL1 isoforms
Next, we examined the functional activities of MKL1 isoforms in NIH3T3 cells. We first checked the expression level of FLAG-tagged MKL1 isoforms. As shown in Fig. 4A, the expression levels of MKL1 isoforms were varied when 0.50–1.00 μg of FLAG-MKL1 expression vectors were transfected. Likewise, we also checked the effects of these four MKL1 isoforms on SRF-mediated transcriptional responses in NIH3T3 cells. All four MKL1 isoforms increased SRF-mediated transcriptional responses (Fig. 4B and C). When the same amounts of MKL1 expression vector were transfected into NIH3T3 cells, MKL1met was the most effective in driving SRF-mediated transcription among the four MKL1 isoforms. On the other hand, all four MKL1 isoforms did not activate cAMP response element (CRE)-mediated transcription significantly in NIH3T3 cells (Fig. 4D).
4. Discussion
In this study, we have identified three transcripts generated from the rat MKL1 gene: two of these, FLMKL1 and BSAC are homologous to mouse MKL1 transcripts, while the third, MELODY, represents a novel transcript (Fig. 1). Analysis of the exon–intron structure of these transcripts demonstrated that each has a distinct 5′-exon, implying that their transcription may be regulated separately by alternative promoters. Searching transcription factor-binding sites revealed that candidate binding sites of transcription factors located upstream of 5′-ends of rat MKL1 isoforms were different. This indicates that different transcription factors may be involved in the transcription of MKL1 isoforms in a spatiotemporal manner. In fact, analysis of their expression profiles revealed that all three MKL1 transcripts are enriched in the nervous system and display distinct spatiotemporal patterns of expression during brain development (Figs. 2 and 3). In terms of expression levels, there was a marked difference among the three MKL1 transcripts; in particular, the expression of MELODY is substantially lower than the other two transcripts (Figs. 2 and 3). Therefore, the influence of endogenous MELODY on SRF-mediated transcription under basal conditions may be negligible.
The functional properties of rat MKL1 isoforms indicates that the novel MKL1 isoform, MELODY, in addition to rat FLMKL1, BSAC, MKL1met isoforms strongly enhanced SRF coactivation (Fig. 4B and C). Analysis of the domain structure of the proteins generated from these MKL1 transcripts indicate that FLMKL1, BSAC and MELODY have three G-actin-binding RPEL motifs, while MKL1met has two RPEL motifs (Fig. 1). Comparison in every amount of MKL1 isoform vectors showed that MKL1met tends to be more active than other isoforms. Three RPEL motifs in a single MKL1 molecule appear to bind to five G-actins [14]. Assuming that loss of one of these RPEL motifs decreases the stoichiometry and/or affinity of the interaction of MKL1 met with G-actin, may promote the nuclear localization, and may cause stronger activity of SRF coactivator function. In this study, we evaluated the effect of overexpressed MKL1 isoforms in NIH3T3 cells. Thus, further studies would be required for identification and function of endogenous MKL1met protein in a variety of cell types and tissues.
Although we have identified rat MKL1 isoforms, it is important to note that additional MKL1 isoforms may remain to be identified. Stern et al. [15] indicate that an MAL/MKL1 variant of relatively small size (approximately 65 kDa) is expressed in neurons. Since the rat MKL1 variants identified in this study are much larger, this smaller variant may represent another rat MKL1 variant that remains to be characterized. Further studies are needed to determine if this putative ∼65 kDa form is generated from a distinct transcript or via alternative translation of one of the three transcripts described herein.
Analysis of another SRF coactivator, myocardin, [16] has demonstrated that alternative splicing gives rise to myocardin protein isoforms with different N-termini, a region that contains RPEL motifs [17]. Notably, differences in this N-terminal region affect binding of myocardin to myocyte enhancer factor 2 (MEF2), thereby regulating MEF2-mediated transcription [17]. In a similar vein, it is conceivable that the different N-termini found in MKL1 isoforms may also mediate their differential interaction with other transcription factors. To clarify the functional role of the distinct N-terminal regions of MKL1 isoforms, further studies aimed at searching for interacting proteins or at examining isoform-specific knock down by RNA interference may be valuable.
In summary, we have identified a set of rat MKL1 transcripts that are differentially expressed in developing and mature brain. Our previous study demonstrated that SRF-target β-actin gene promoter was increased by overexpression of mouse MKL1 and MKL2 in primary cultured cortical neurons [12]. To precisely investigate differential effects of MKL1 isoforms on endogenous SRF-target genes, the rescue experiments with overexpression of MKL1 isoforms in the cells, derived from MKL1 knock-out mice, might be needed. Taken together, our findings suggest that expression of multiple MKL1 isoforms helps to fine tune changes in gene expression in both developing and mature brain.
Conflict of interest
The authors have no competing financial interest or further conflict of interest.
Acknowledgements
This study was supported by a grant-in aid from the Ministry of Education, Culture, Sports, Science and Technology of Japan (Project No. 17790055, 19790052 and 22590080, A.T.; 20390023, M.T.; 23890065, M.I.) and by research grants from the Hayashi Memorial Foundation for Female Natural Scientists (A.T.), Foundation of the first Bank of Toyama (A.T.), Takeda Science Foundation (A.T.), Narishige Neuroscience Research Foundation (A.T.) and the Research Foundation for Pharmaceutical Sciences (A.T.).
Footnotes
This is an open-access article distributed under the terms of the Creative Commons Attribution-NonCommercial-No Derivative Works License, which permits non-commercial use, distribution, and reproduction in any medium, provided the original author and source are credited.
Supplementary material
Supplementary material associated with this article can be found, in the online version, at doi:10.1016/j.fob.2013.09.001.
Appendix. Supplementary materials
Supplementary material for Identification, expression and characterization of rat isoforms of the serum response factor (SRF) coactivator MKL1
References
- 1.Wang D.Z., Li S., Hockmeyer D., Sutherland L., Wang Z., Schratt G., Richardson J.A., Nordheim A., Olson EN. Potentiation of serum response factor activity by a family of myocardin-related transcription factors. Proc. Nat. Acad. Sci. USA. 2002;99:14855–14860. doi: 10.1073/pnas.222561499. [DOI] [PMC free article] [PubMed] [Google Scholar]
- 2.Sasazuki T., Sawada T., Sakon S., Kitamura T., Kishi T., Okazaki T., Katano M., Tanaka M., Watanabe M., Yagita H., Okumura K., Nakano H. Identification of a novel transcriptional activator, BSAC, by a functional cloning to inhibit tumor necrosis factor-induced cell death. J. Biol. Chem. 2002;277:28853–28860. doi: 10.1074/jbc.M203190200. [DOI] [PubMed] [Google Scholar]
- 3.Selvaraj A., Prywes R. Megakaryoblastic leukemia-1/2, a transcriptional co-activator of serum response factor, is required for skeletal myogenic differentiation. J. Biol. Chem. 2003;278:41977–41987. doi: 10.1074/jbc.M305679200. [DOI] [PubMed] [Google Scholar]
- 4.Cen B., Salvaraj A., Prywes R. Myocardin/MKL family of SRF coactivator: key regulators of immediate early and muscle specific gene expression. J. Cell Biochem. 2004;93:74–82. doi: 10.1002/jcb.20199. [DOI] [PubMed] [Google Scholar]
- 5.Pipes G.C., Creemers E.E., Olson E.N. The myocardin family of transcriptional coactivators: versatile regulators of cell growth, migration and myogenesis. Genes Dev. 2006;20:1545–1556. doi: 10.1101/gad.1428006. [DOI] [PubMed] [Google Scholar]
- 6.Miralles F., Posern G., Zaromytidou A.I., Treisman R. Actin dynamics control SRF activity by regulation of its coactivator MAL. Cell. 2003;113:329–342. doi: 10.1016/s0092-8674(03)00278-2. [DOI] [PubMed] [Google Scholar]
- 7.Posern G., Miralles F., Guettler S., Treisman R. Mutant actins that stabilize F-actin use distinct mechamisms to activate the SRF coactivator MAL. Embo J. 2004;23:3973–3983. doi: 10.1038/sj.emboj.7600404. [DOI] [PMC free article] [PubMed] [Google Scholar]
- 8.Vartiainen M.K., Guettler S., Larijani B., Treisman R. Nuclear actin regulates dynamis subcellular localization and activity of the SRF cofactor MAL. Science. 2007;316:1749–1752. doi: 10.1126/science.1141084. [DOI] [PubMed] [Google Scholar]
- 9.Tabuchi A., Estevez M., Henderson J.A., Marx R., Shiota J., Nakano H., Baraban J.M. Nuclear translocation of the SRF co-activator MAL in cortical neurons: role of RhoA signaling. J. Neurochem. 2005;94:169–180. doi: 10.1111/j.1471-4159.2005.03179.x. [DOI] [PubMed] [Google Scholar]
- 10.Kalita K., Kharebava G., Zheng J.J., Hetman M. Role of Megakaryoblastic acute leukemia-1 in ERK1/2-dependent stimulation of serum response factor-driven transcription by BDNF or increased synaptic activity. J. Neurosci. 2006;26:10020–10032. doi: 10.1523/JNEUROSCI.2644-06.2006. [DOI] [PMC free article] [PubMed] [Google Scholar]
- 11.Shiota J., Ishikawa M., Sakagami H., Tsuda M., Baraban J.M., Tabuchi A. Developmental expression of the SRF co-activator MAL in brain: role in regulating dendritic morphology. J. Neurochem. 2006;98:1778–1788. doi: 10.1111/j.1471-4159.2006.03992.x. [DOI] [PubMed] [Google Scholar]
- 12.Ishikawa M., Nishijima N., Shiota J., Sakagami H., Tsuchida K., Mizukoshi M., Fukuchi M., Tsuda M., Tabuchi A. Involvement of the SRF coactivator megakaryoblastic leukemia in the activin-regulated dendritic complexity of rat cortical neurons. J. Biol. Chem. 2010;285:32734–32743. doi: 10.1074/jbc.M110.118745. [DOI] [PMC free article] [PubMed] [Google Scholar]
- 13.Heinemeyer T., Wingender E., Reuter I., Hermjakob H., Kel A.E., Kel O.V., Ignatieva E.V., Ananko E.A., Podkolodnaya O.A., Kolpakov F.A., Podkolodny N.L., Kolchanov N.A. Databases on transcriptional regulation: TRANSFAC, TRRD, and COMPEL. Nucleic Acids Res. 1998;26:364–370. doi: 10.1093/nar/26.1.362. [DOI] [PMC free article] [PubMed] [Google Scholar]
- 14.Mouilleron S., Langer C.A., Guettler S., McDonald N.Q., Treisman R. Structure of a pentavalent G-actin MRTF-A complex reveals how G-actin controls nucleocytoplasmic shuttling of a transcriptional coactivator. Sci. Signal. 2011;4 doi: 10.1126/scisignal.2001750. ra40. [DOI] [PubMed] [Google Scholar]
- 15.Stern S., Debre E., Stritt C., Berger J., Posern G., Knöll B. A nuclear actin function regulates neuronal motility by serum response factor-dependent gene transcription. J. Neurosci. 2009;29:4512–4518. doi: 10.1523/JNEUROSCI.0333-09.2009. [DOI] [PMC free article] [PubMed] [Google Scholar]
- 16.Wang D., Chang P.S., Wang Z., Sutherland L., Richardson J.A., Small E., Krieg P.A., Olson E.N. Activation of cardiac gene expression by myocardin, a transcriptional cofactor fro serum response factor. Cell. 2001;105:851–862. doi: 10.1016/s0092-8674(01)00404-4. [DOI] [PubMed] [Google Scholar]
- 17.Creemers E.E., Sutherland L.B., Oh J., Barbosa A.C., Olson E.N. Coactivation of MEF2 by the SAP domain proteins myocardin and MASTR. Mol. Cell. 2006;23:83–96. doi: 10.1016/j.molcel.2006.05.026. [DOI] [PubMed] [Google Scholar]
Associated Data
This section collects any data citations, data availability statements, or supplementary materials included in this article.
Supplementary Materials
Supplementary material for Identification, expression and characterization of rat isoforms of the serum response factor (SRF) coactivator MKL1