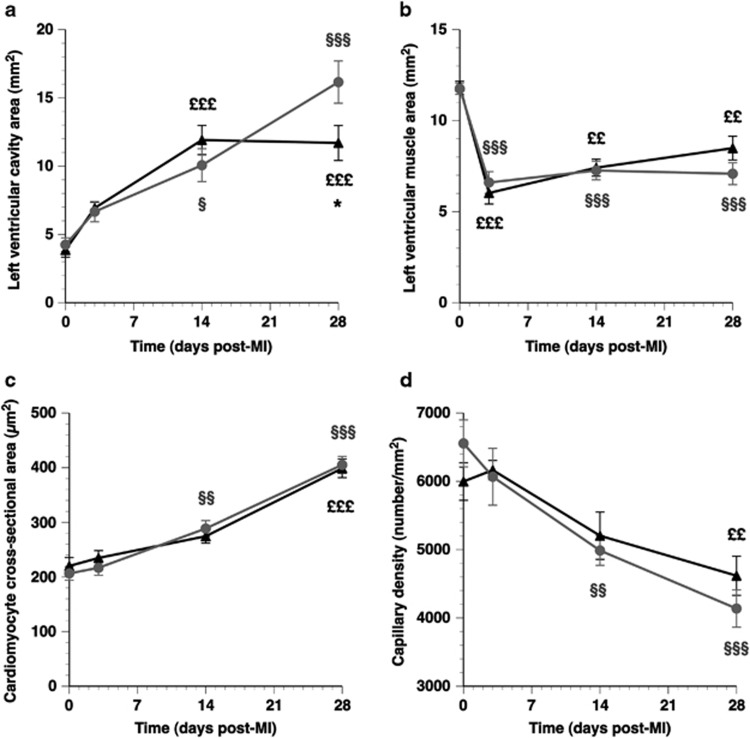
Figure 3.
Time course of left ventricular remodelling in control MI mice (grey circles) and AdA-I MI mice (black triangles). Longitudinal changes in left ventricular cavity area, left ventricular muscle area, cardiomyocyte cross-sectional area and capillary density are illustrated in panels (a–d), respectively. Data represent means±s.e.m. (n is identical as indicated in the Legend to Figure 2). For reasons of clarity, only statistical differences between day 0 and other time points, or differences between control MI mice and AdA-I MI mice are indicated. §P<0.05; §§P<0.01; §§§P<0.001 for longitudinal comparisons versus day 0 control MI. ££P<0.01; £££P<0.001 for longitudinal comparisons versus day 0 AdA-I MI. *P<0.05 for control MI versus AdA-I MI.

