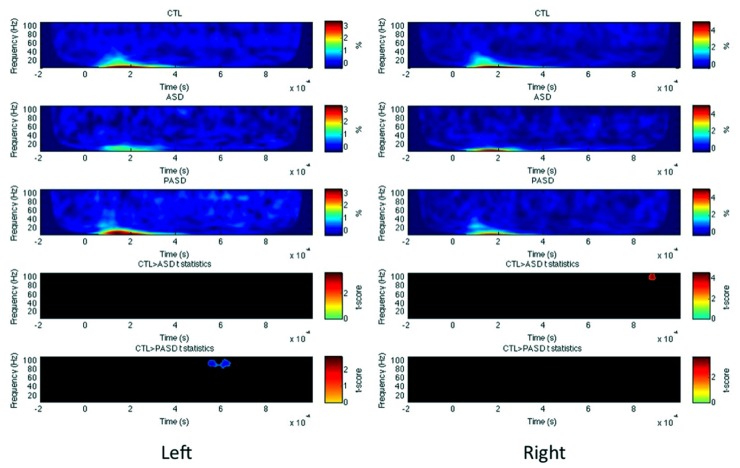
FIGURE 3.
Superior temporal gyrus evoked power time-frequency results. Grand average evoked power is shown for each group (three top rows) for the left and right superior temporal gyrus (STG). T-statistic maps are shown in the two bottom rows that illustrate contrasts between controls (CTL) and ASD (row 4) and CTL and parents (PASD; row 5). Masked t-score results represent cluster-corrected findings at p < 0.01.

