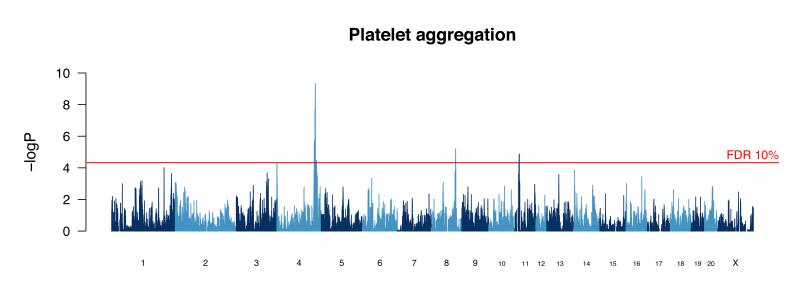
Figure 2. Genome scan for platelet aggregation.
The scan shows the results of a haplotype mixed model. The vertical scale is the negative logarithm of the P-value (logP) for association with variation in platelet aggregation. The peak on chromosome 4 harbors the von Willebrand factor gene that is identified through sequence analysis as the causative gene.

