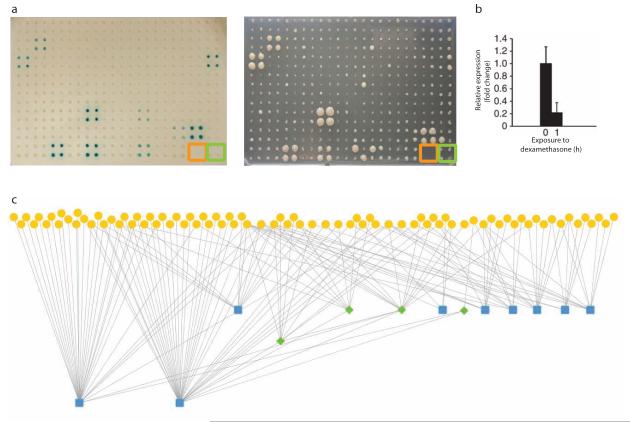
Figure 2.
Using the transcription factor resource in an eY1H assay. (a) Reporter assay readout with the REV promoter and 94 transcription factors. Empty wells (orange) and negative control (green) are marked. Scale bar, 4 mm. (b) Relative expression of REV in the 35S-OBP2–glucocorticoid receptor line after induction with dexamethasone. Error bars, s.e.m. (n = 3; ~100 plants per biological replicate). (c) The stele gene regulatory network for the 13 screened promoters. Yellow circles are transcription factors, green diamonds are in the screen as both transcription factors and promoters, and blue squares are promoters.

