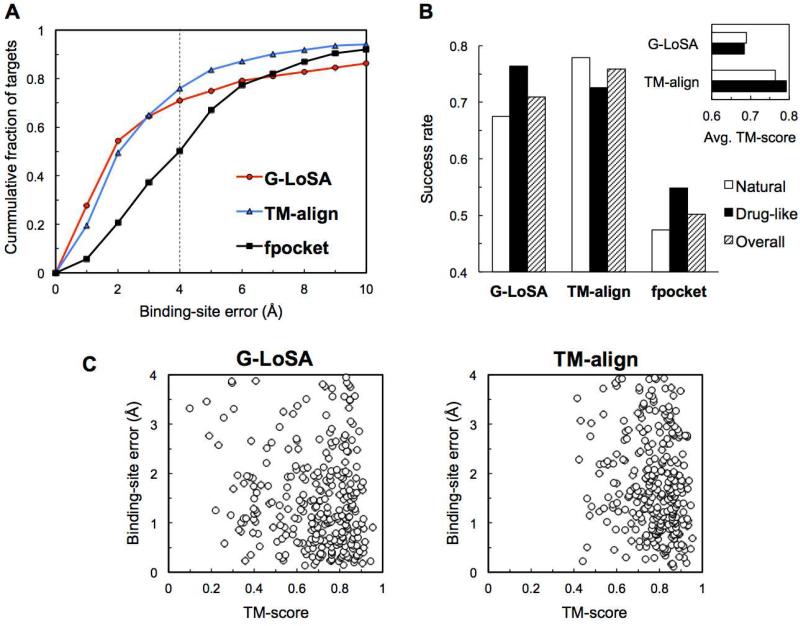
Figure 2.
Performance comparison of different methods in predicting ligand BS for SET-S. (A) Cumulative fraction of targets versus the best BS-error in top five predictions. (B) Success rates of different methods for natural ligands and drug-like compounds. The inset presents the average TM-score over the best templates for each target. The best template is a template with the highest score in the cluster of the lowest BS-error. (C) Binding-site error as a function of the TM-score of the best template for successful targets.

