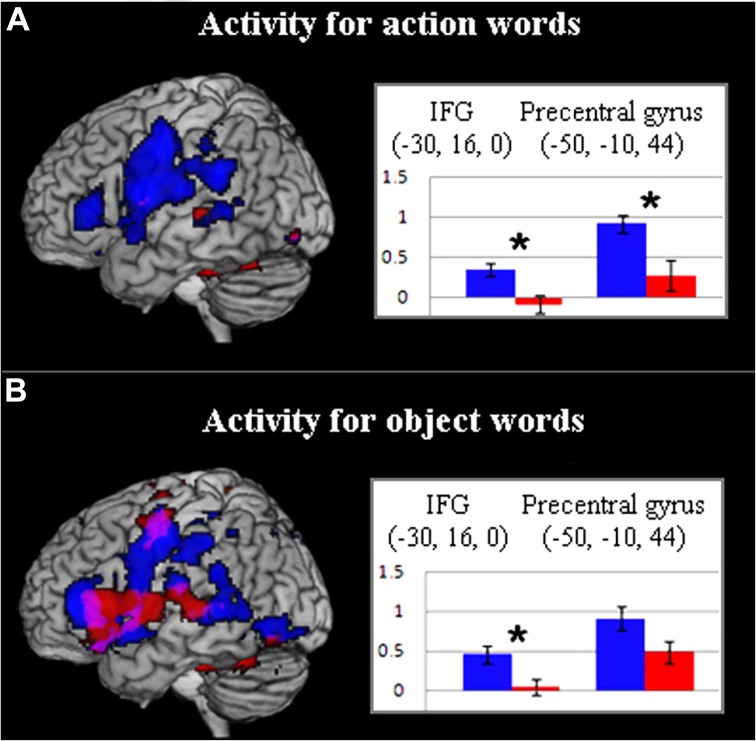
FIGURE 3.
(A) Activity for action words in control (blue) and ASC (red) participants (p < 0. 005, uncorr.). Bar charts depict action-word activity for both groups in key inferior frontal and precentral ROIs. (B) Activity for object words in control (blue) and ASC (red) participants (p < 0.005, uncorr.). For further explanation, see legend for (A). In (A,B), values along the y-axis reflect parameter estimates (arbitrary units) reflecting the difference in activation between action or object words respectively and the baseline condition (hash-marks).

