Figure 3. The C2A domain of UNC-13L is required for the precise localization of UNC-13L at active zones.
(A1) Representative confocal Z-stack images of co-immunostaining for ELKS-1 and UNC-10/RIM from wild type and unc-13(n2609). (A2) Average fluorescence intensities in six-pixel wide regions along a line drawn down the dorsal nerve cord (DNC) shown in A1 corresponding to ELKS-1 and UNC-10/RIM signals. Peaks from ELKS-1 and UNC-10/RIM signals are differentially marked. The distances between the nearest peaks from fluorescence traces of ELKS-1 and UNC-10/RIM, which are less than 800 nm, are plotted against the positions of peaks along the line drawn down the DNC. The color broken lines indicate intensity thresholds to detect peaks from corresponding channels. The grey broken line indicates the average peak distance from that sample. (A3) Average pixel-by-pixel fluorescence intensity correlation coefficients between paired signals or shuffled data from ELKS-1 and UNC-10/RIM in wild type and unc-13(n2609). (A4) Summary of the peak distances between ELKS-1 and UNC-10/RIM signals in wild type and unc-13(n2609). (B1-4) Representative confocal Z-stack images (B1), average pixel-by-pixel fluorescence intensity correlation coefficients (B3), peak distance calculation from images shown in B1 (B2) and summary (B4) of co-immunostaining for UNC-13L and UNC-10/RIM from wild type and unc-13(n2609). (C1-4) Representative confocal Z-stack images (C1), average pixel-by-pixel fluorescence intensity correlation coefficients (C3), peak distance calculation from images shown in C1 (C2) and summary (C4) of co-immunostaining for UNC-13L and UNC-10/RIM from unc-13(s69); Si(UNC-13L) and unc-13(s69); Si(UNC-13LC2A−). Scale bar: 5 µm in pictures and 0.5 µm in inserts for A1, B1 and C1. For each intensity correlation comparison, a shuffled data set was also used to calculate the extent of random correlation between images (see ‘Materials and methods’). AFU, arbitrary fluorescence units. The number of animals analyzed is indicated for each genotype. Error bars indicate SEM. Statistics, two-tailed Student’s t test. ***p<0.001 for comparison between genotypes; ###p<0.001 for comparison between paired data set and shuffled data set for each genotype.

Figure 3—figure supplement 1. Loss of C2A domain does not change the co-localization between Ca2+ channel and UNC-10/RIM.

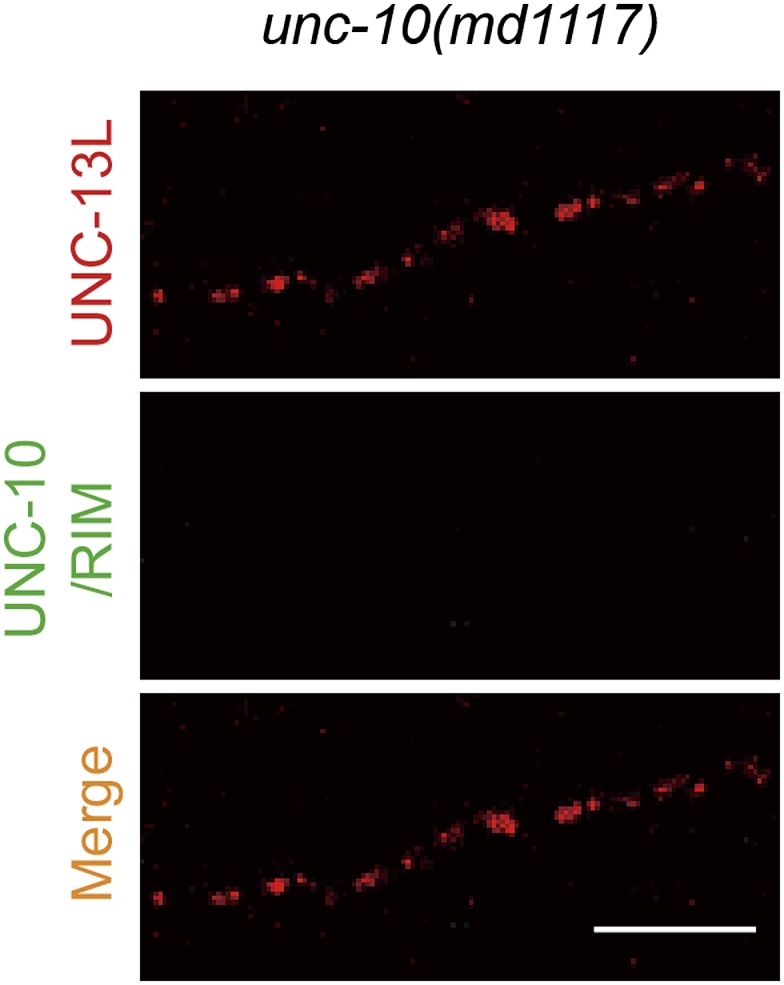
Figure 3—figure supplement 2. Presynaptic localization of UNC-13 is not solely dependent on UNC-10/RIM.