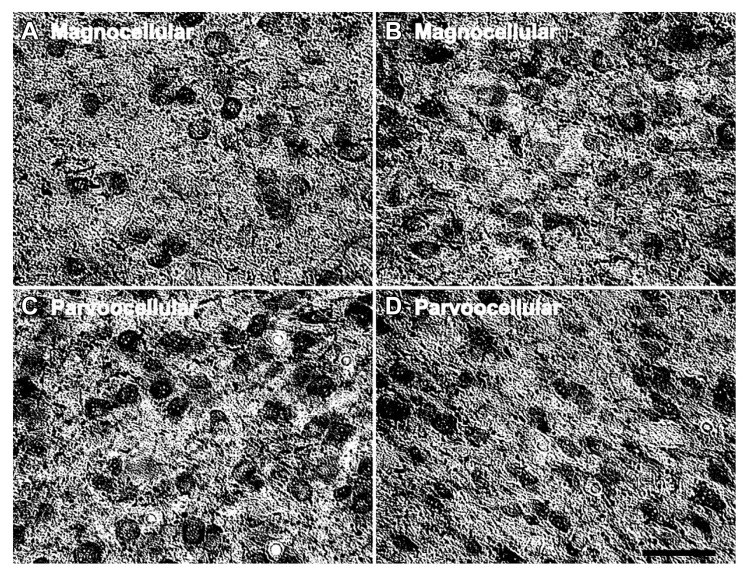
FIGURE 4.
Age-related changes in the number of parvalbumin positive cells in the LGN. Comparison of micrographs from a (A) 15 year old magnocellular layer 2 and (B) 35 year old magnocellular layer 2 reveals apparent age-related increases in the number of PV+ cells. Likewise, a comparison of micrographs from a (C) 15 year old parvocellular layer 3 with a (D) 35 year old parvocellular layer 3 show similar increases. The left side of this image corresponds to the medial aspect and the top to the dorsal aspect of the sections. Scale bar = 150 μm.

