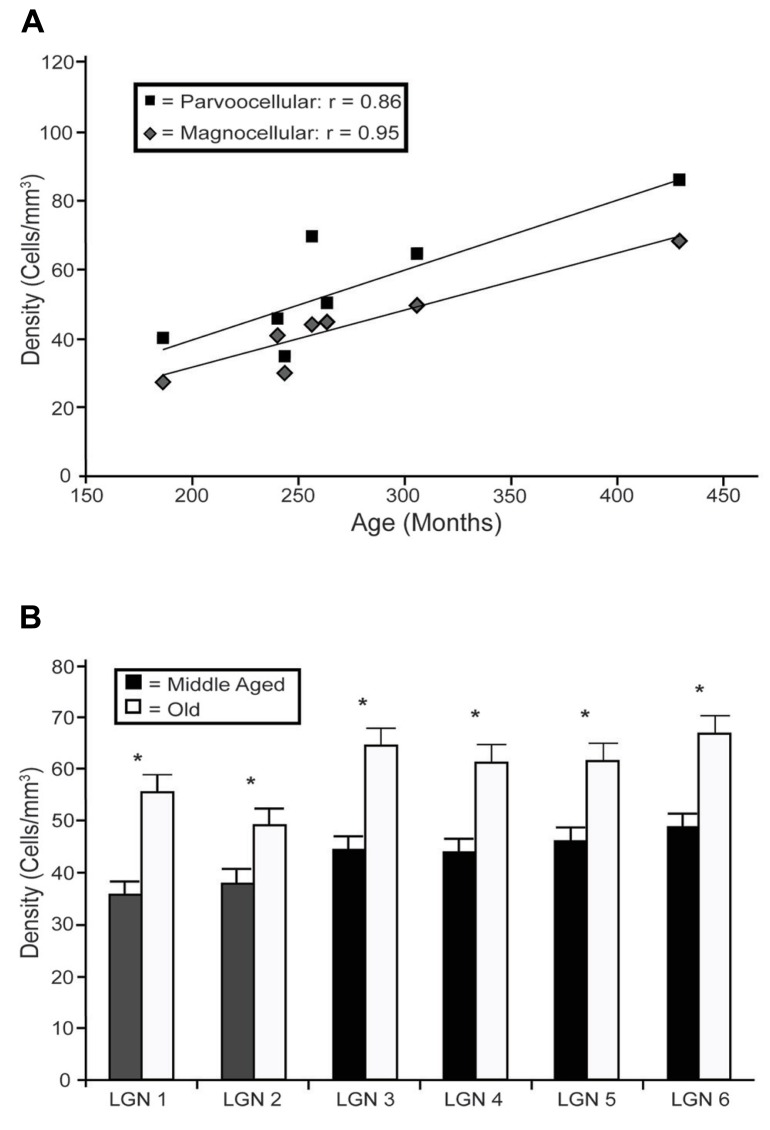
FIGURE 5.
Age-related changes in PV positive neuron density from the layers of the LGN. (A) Regression analyses of the estimated densities of PV+ labeled cells from the magnocellular (layers 1 and 2; gray squares) and parvocellular (layers 3 through 6; black diamonds) layers as a function of age showed significant correlations in all layers with the exception of layer 5. (B) Estimated densities of the six individual layers when the animals were combined into middle aged and old age groups revealed significant increases in all LGN layers. Asterisks indicate significance by an unpaired t-test at an alpha level of 0.01.

