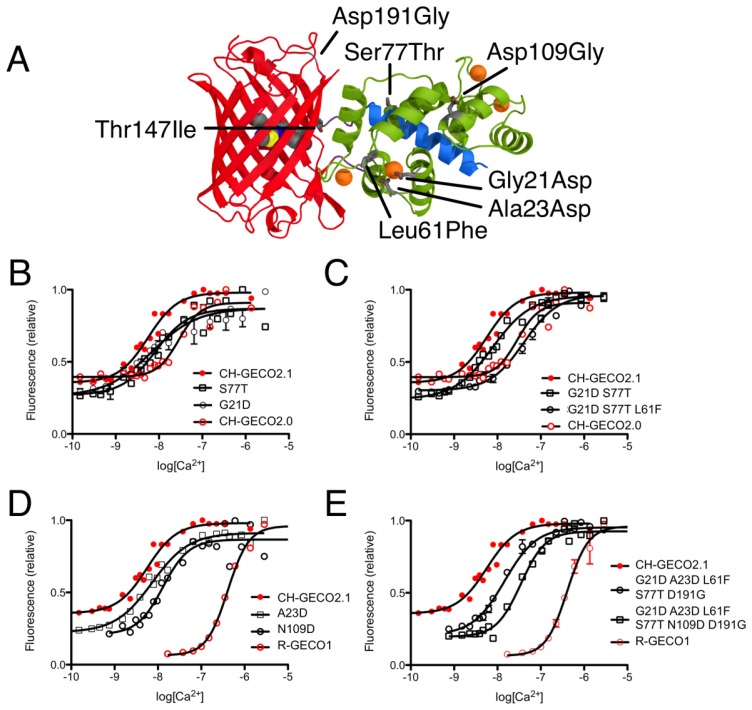
Figure 3.
Probing the differences in Ca2+ affinity between CH-GECO2.0, CH-GECO2.1, and R-GECO1. (A) Location of amino acid substitutions that differentiate the indicators, represented using the R-GECO1 crystal structure [8]. Mutations are labeled relative to CH-GECO2.1. (B) Ca2+ titration curves for variants with single mutations that revert CH-GECO2.1 CaM to CH-GECO2.0 CaM. (C) Ca2+ titration curves for variants with multiple mutations that revert the CaM domain of CH-GECO2.1 to that of CH-GECO2.0. (D) Ca2+ titrations for two of the point mutants that revert CH-GECO2.1 to R-GECO1. (E) Ca2+ titrations for CH-GECO2.1 variants with the CaM domain partially and completely converted to the R-GECO1 CaM domain.

