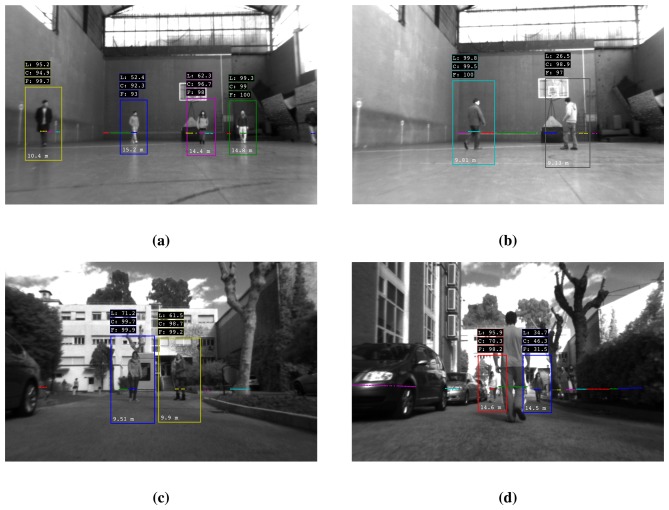
Figure 10.
Detector images from the gymnasium (a), (b) and outdoor experiments (c), (d). The boxes above each cluster give the probability of the laser and image detection modules and the mean fused probability. Cluster distance is shown at the bottom of the enclosing rectangle. (a) Typical scenario with multiple people, movement in various directions and occlusions. (b) The laser module does not detect the right person correctly. Due to correct camera classification, the person is eventually detected after fusion. (c) Outdoors, the laser detector performance is considerably lower. (d) The right person (blue rectangle) is misclassified from both sensor modules. The person in the middle is too close to the camera; in this case, the cluster is evaluated by the laser classifier only. Persons hidden by the bench on the right are not detected by the laser.

