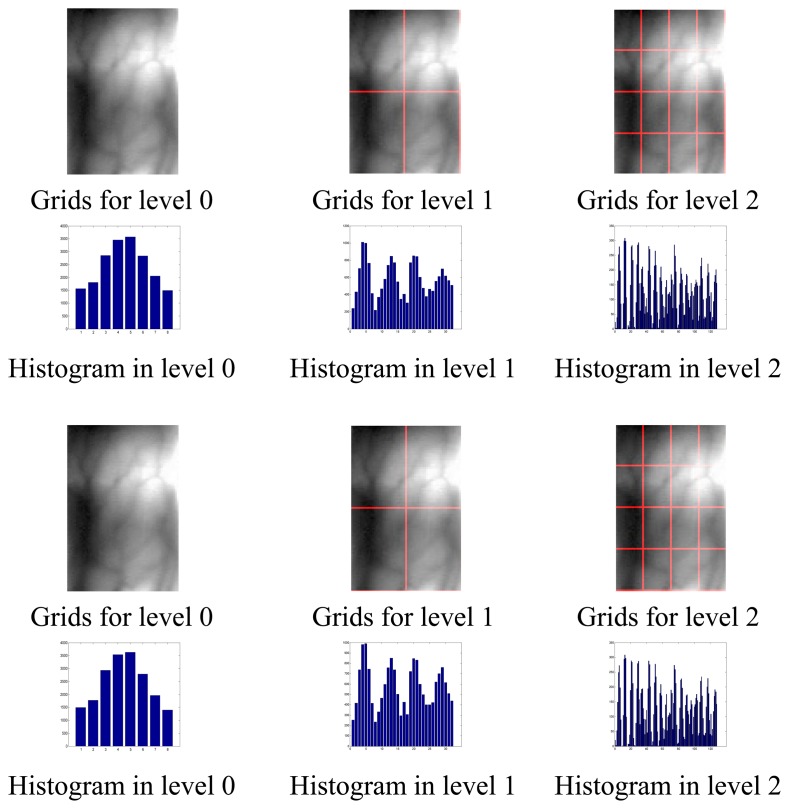
Figure 2.
Texture spatial pyramid representation. The first row and the third row: two images from same subject and grids for levels L = 0 to L = 2; the second row and the fourth row: histogram representations corresponding to each level. The final PHT vector is a concatenation of vectors (histograms) for all levels.

