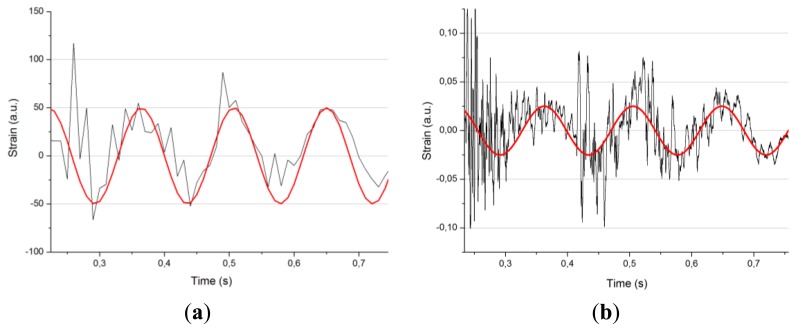
Figure 11.
Strain value graph recorded at 100 Hz by means of the MicronOptics interrogator (a) and data for a same location and energy impact obtained with a 20 KHz interrogator (b). In red there is a sinusoidal pattern of 7 Hz to serve as a help when identifying the fundamental frequency of the studied signal.

