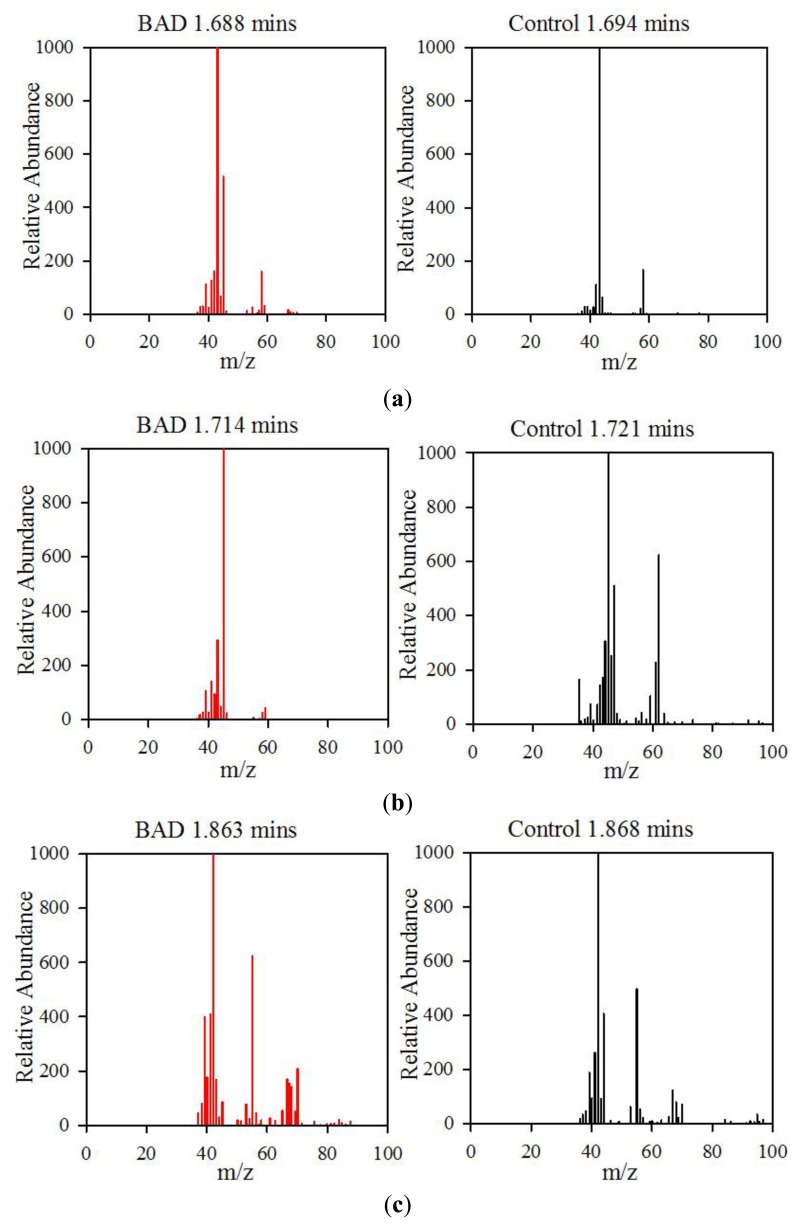
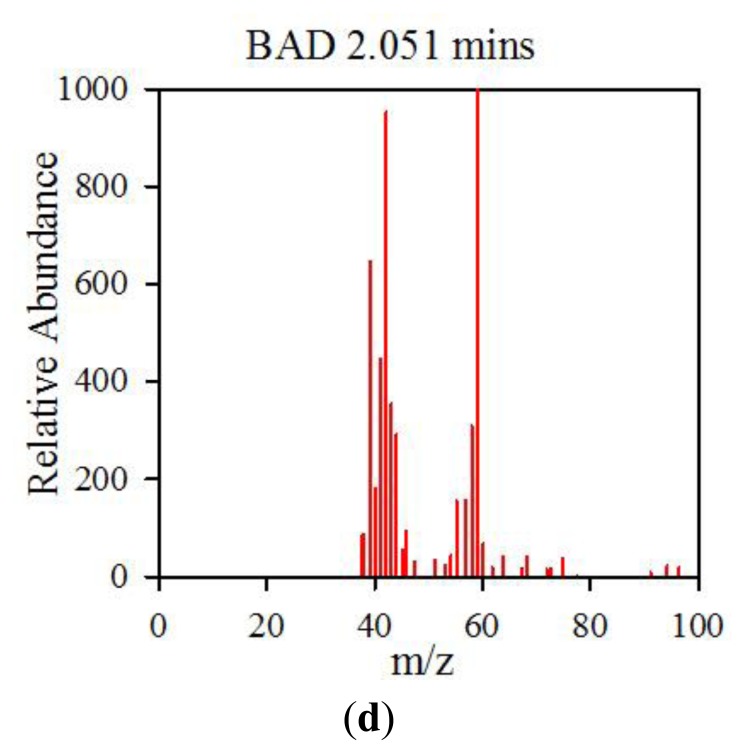
Figure 6.
Comparison of BAD and Control Mass Spectra at similar Retention Times. (a) These spectra show similar mass ion ratios at 43 and 58, indicating the groups of Acetone. (b) These have similar mass ion peaks at and around 45, potentially indicating an alcohol as a common root. However, BAD yields much higher concentration, and there are extra mass ion peaks present in controls. (c) These have similar mass ion ratios for most significant peaks (42, 55, 41, etc.), indicating a common root. (d) This shows a unique set of mass ion ratios not found in controls, with a peak at 59 indicating an amide.


