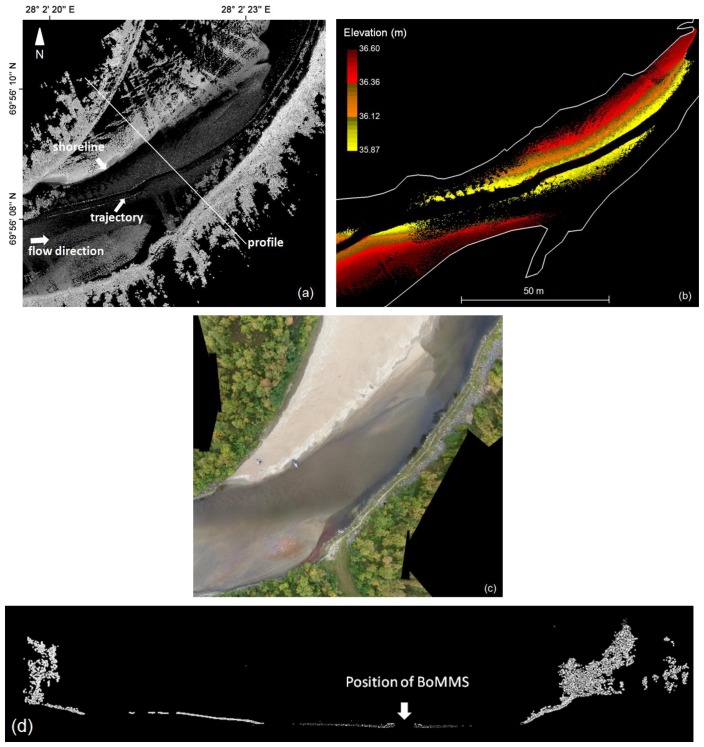
Figure 5.
(a) Intensity image of the point cloud. The trajectory of the BoMMS is clearly visible as the occluded area in the middle of the river. The intensity value clearly changes at the border of the land and water areas; (b) The elevation coloured bathymetry points from the same area and digitized shoreline; (c) UAV mosaic; (d) Cross-sectional profile of the channel and point bar (location of the profile is marked on (a)).

