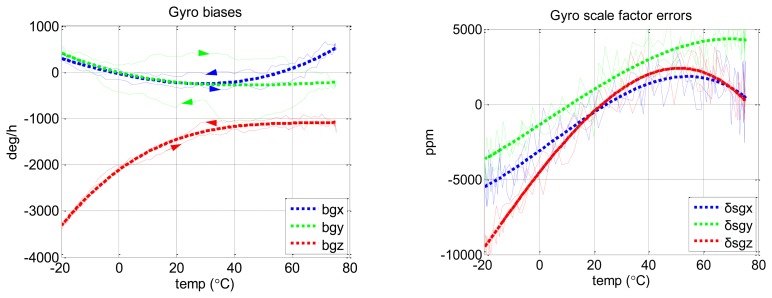
Figure 7.
Thermal calibration results of MTi-G gyro biases and scale factor errors with proposed method. The thin dashed lines show the raw calibration results (i.e., the result of each calibration scheme). Rightward and leftwards arrows indicate heating and cooling processes, respectively. The thick dashed lines are the final fitted results (3rd-order polynomial fit).

