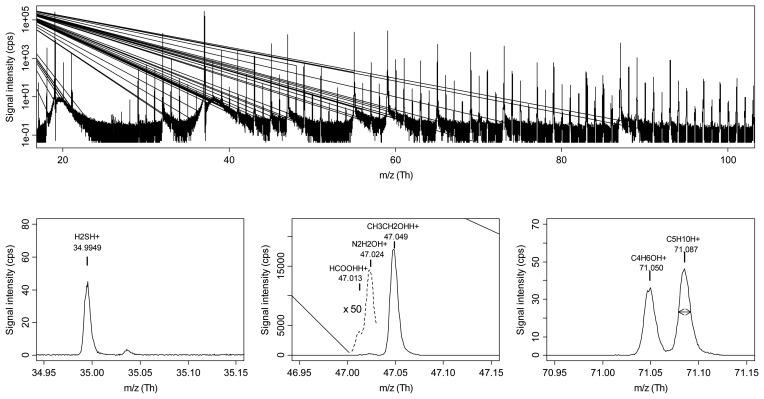
Figure 2.
PTR-TOF-MS spectrum of a cheese sample headspace. The upper panel shows the mass region (20–100 Th). The lower panels enlarge the regions around few selected peaks. Reprinted with permission from ref. [60]. Copyright 2010 John Wiley & Sons, Ltd.

