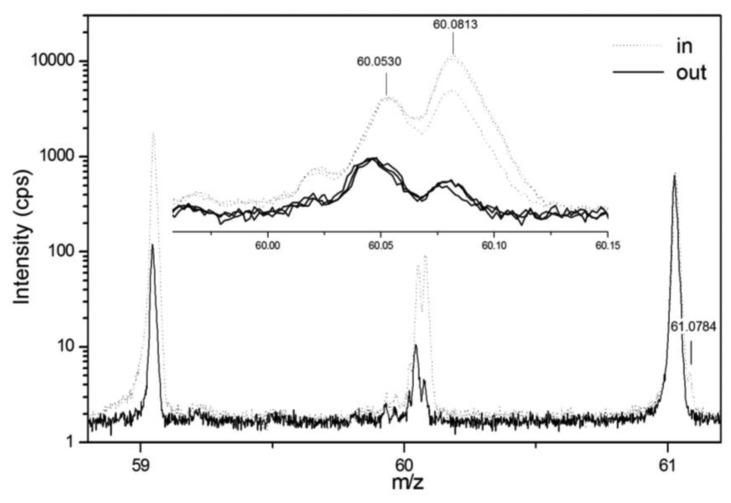
Figure 6.
Excerpt of the PTR-TOF-MS spectra of six samples collected upstream (dotted lines) and downstream (continuous lines) a biofilter. The upper panel is a detail of the peak at m/z = 60. Numbers indicate the expected exact mass of protonated monosubstituted acetone isotope (60.053) and of protonated trimethylamine (60.0813). At mass 61.0784 the mono substituted isotope of trimethylamine is also indicated. Reprinted from [129], with permission from the copyright holders, IWA Publishing.

