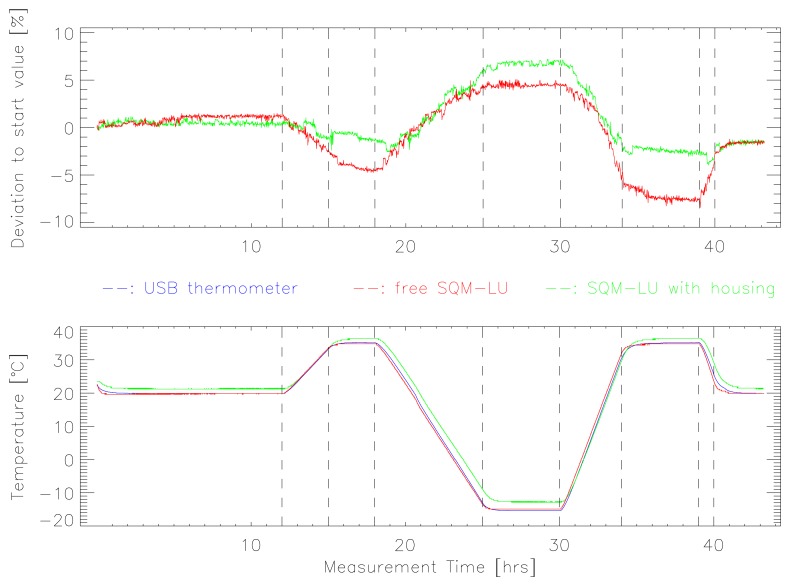
Figure 3.
The observed deviation from the original radiance during the long temperature stability test (Test 1) is shown at top for a free SQM-LU (red), and for an SQM-LU inside of the standard weatherproof housing (green). The lower plot shows the temperature curve measured by the SQMs and the USB thermometer (blue). Dashed vertical lines show the time when temperature ramps were started or stopped.

