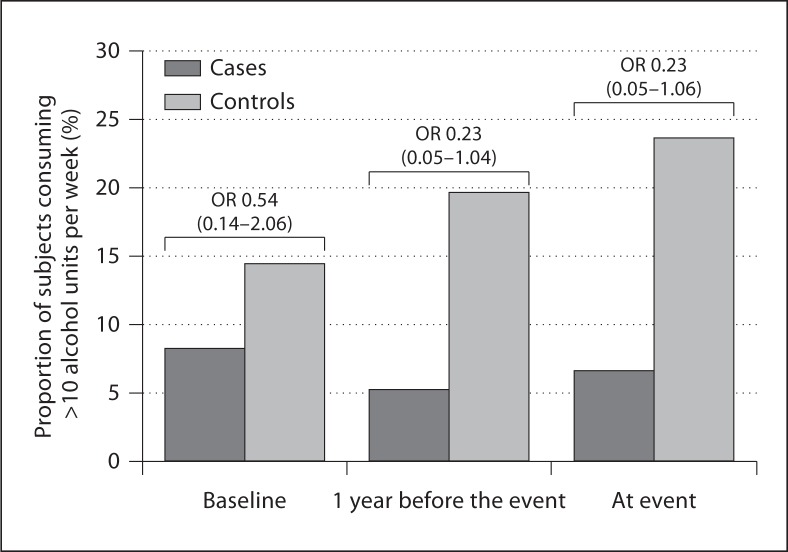
Fig. 2.
Proportion of subjects consuming >10 units/week in cases (dark gray bars) and in controls (matched for age, duration of follow-up and smoking behavior – light gray bars) at baseline, 1 year prior to event and at the time of event in study B (development of overt hypothyroidism). OR denotes odds ratio and the 95% confidence intervals are in parentheses.

