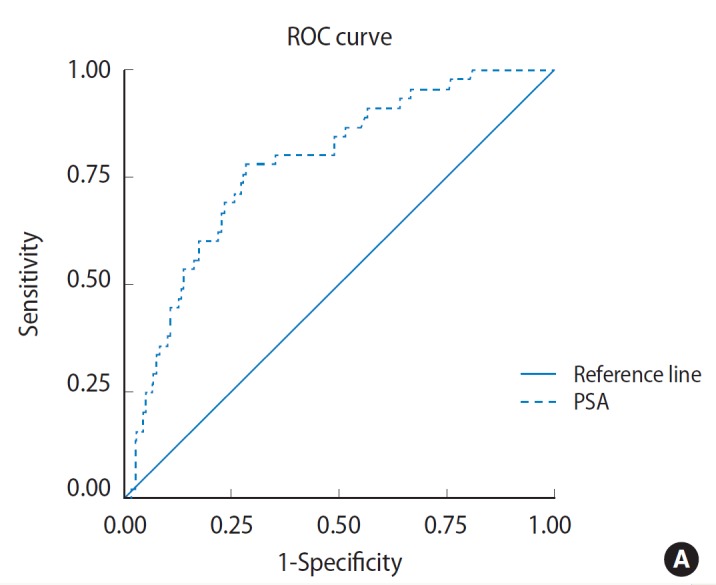
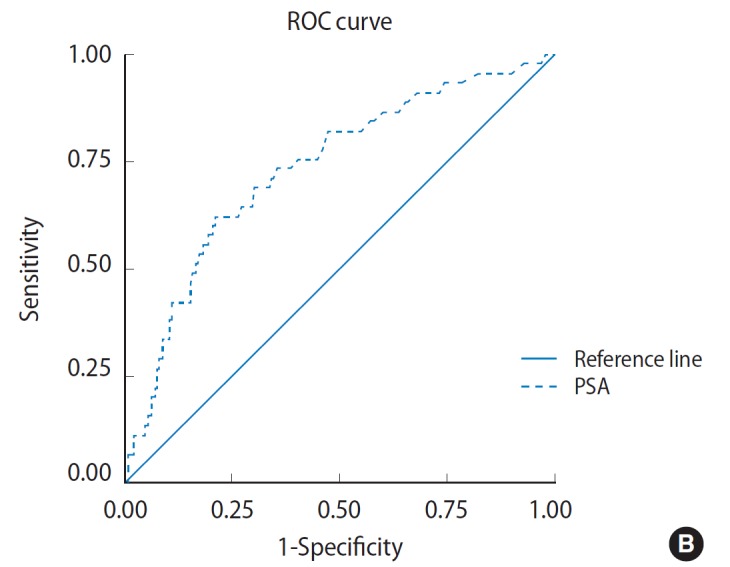
Fig. 1.


Receiver operating characteristics (ROC) curve depicting diagnostic accuracy of prostate-specific antigen (PSA) (A) and diagnostic accuracy of PSA density (B). The ROC curve shows perpendicular height above the diagonal and wide area under the curve indicating that it is an accurate test.
