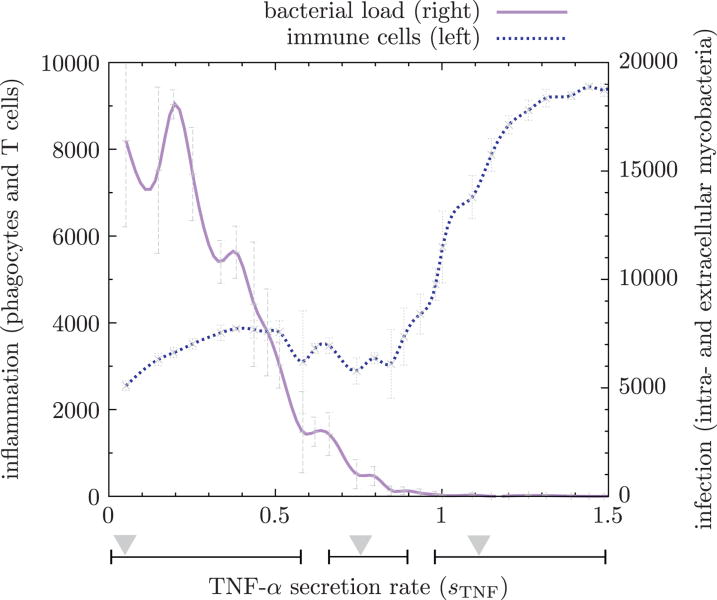
Figure 5.
Dose-dependent response of TNF-α secretion rate on bacterial load and immune cell numbers. Too little TNF-α results in uncontrolled bacterial growth; the interval of this phenomenon is shown by the leftmost horizontal bar under the graph where the triangle indicates sP,TNF = 0.1 corresponding to Figure 6a. The second horizontal bar denotes intermediate levels of TNF-α resulting in containmnent/clearance as shown in Figure 6b. The second triangle corresponds to the baseline containment scenario where sP,TNF = 0.7. The third bar shows high levels of TNF-α which do lead to clearance as well as harmful hyperinflammation (see Figure 6c, triangle at sP,TNF = 1.1). Vertical error bars indicate standard deviations of n = 5 repetitions.

