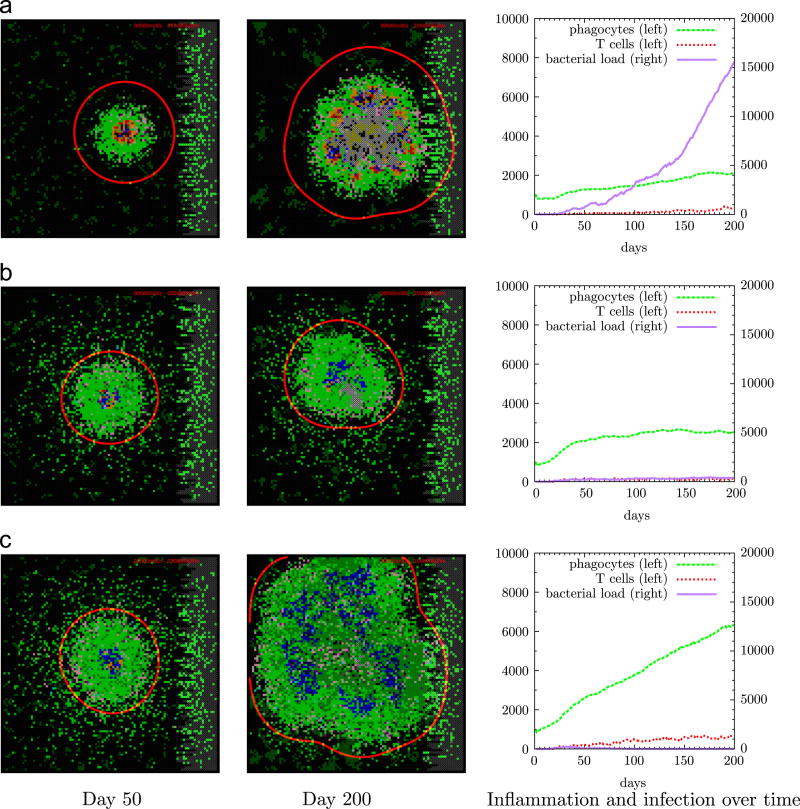
Figure 6.
Three TNF-α secretion-rate scenarios (A–C). First two columns show snapshots of the grid at days 50 and 200, third column shows numbers of bacteria and immune cells over time. Scenario A (uncontrolled bacterial growth, sP,TNF = 0.1) shows scattered ramified microglia in dark green and bacteria at the center in brown together with infected phagocytes in yellow and red, and a substantial amount of caseation in grey. Scenario B (containment, sP,TNF = 0.7) shows a stable granuloma with a core of little caseation and infected (red) and activated (blue) phagocytes surrounded by resting phagocytes (green) and a rim of T cells (purple and pink). Scenario C (hyperinflammation, sP,TNF = 1.1) shows high numbers of phagocytes and lymphocytes in the absence of bacteria. Time-lapse movies of these scenarios can be found in the supplementary information.

