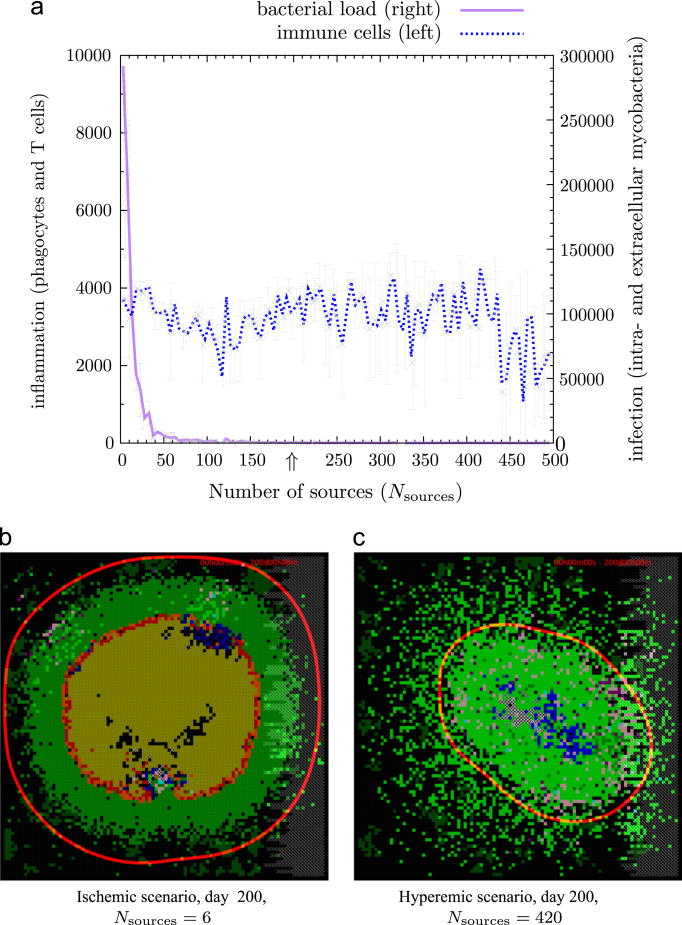
Figure 7.
Effect of vascularization on bacterial load and immune cell numbers. A low number of vascular sources hampers the recruitment of macrophages and T cells leaving microglia as the predominant phagocyte, which are unable to contain the infection resulting in the formation of pus as shown in (b). A high degree of vascularization results in clearance of bacteria and increased influx of immune cells as shown in (c). In the hyperemic scenario the predominant phagocytes are macrophages. Figure 8 shows how phagocyte and lymphocyte numbers develop over time in both scenarios. The arrow at Nsources = 200 indicates our baseline containment scenario. All experiments were performed using the baseline containment scenario (Supplementary Table 1) with intermediate TNF-α levels. Time-lapse movies of these two scenarios can be found in the supplementary information.

