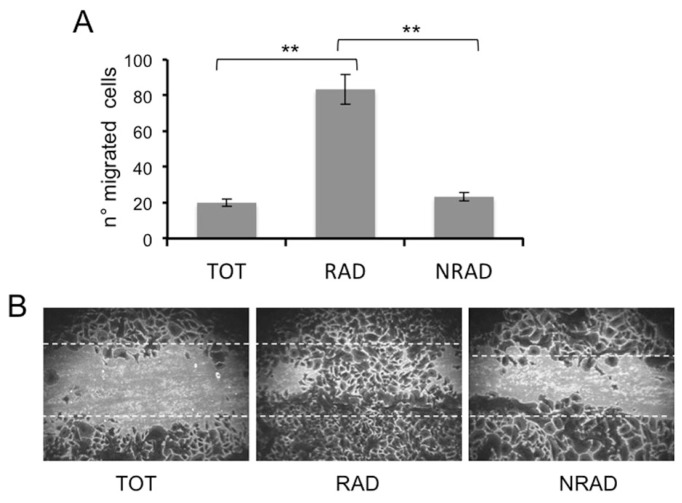
Figure 5.
Migration ability of cSCCs subpopulations. The migration of RAD, NRAD and TOT cells was determined by scratching assay. Cells were fixed and stained, and the number of migrated cells to the scratched surface area was counted. (A) Number of migrated cells expressed as the mean + SD from triplicate experiments, *p < 0.05, **p < 0.01; (B) Representative images of migrated cSCCs subpopulations in the scratching assay.

