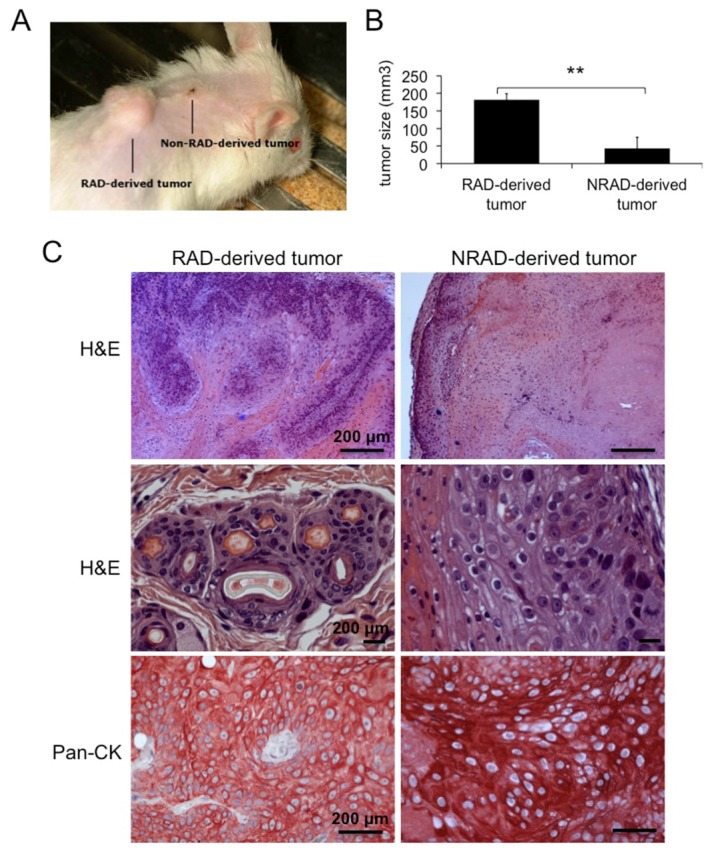
Figure 6.
Tumorigenic ability of cSCC cells subpopulations in vivo. (A) Representative picture of RAD and NRAD-derived tumors formed by xenografting cSCC keratinocytes onto NOD/SCID mice; (B) Size of RAD and NRAD derived tumors as measured in three independent experiments. *p < 0.05, **p < 0.01; (C) Hematoxilin & Eosin and Pan-cytokeratin (CK) staining of RAD and NRAD-derived tumors. Scale bars = 200 μm.

