
Figure 5.
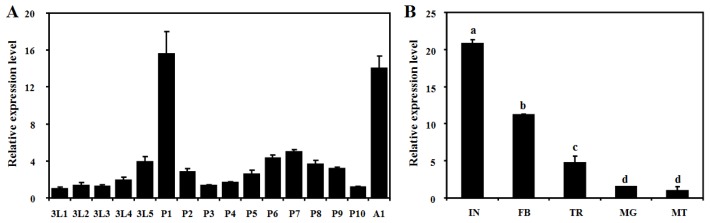
Expression profiles of BdCht2 as determined by qPCR. (A) Expression of BdCht2 at different developmental stages. 3L1, day-1 third-instar larvae; P1, day-1 pupae; A1, day-1 adults; (B) Tissue distribution of BdCht2 in third-instar larvae. The tissues include integument (IN), fat body (FB), trachea (TR), midgut (MG) and Malpighian tubules (MT). Different letters above each bar indicate significant difference (ANOVA, Duncan’s new multiple range test (DMRT), p < 0.05). The error bars represent the means and standard errors of three replicates.