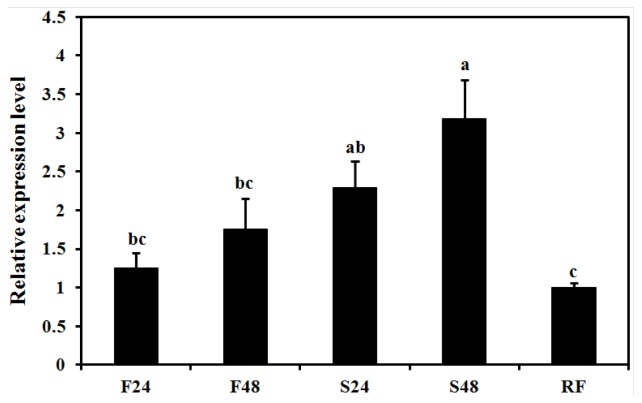
Figure 7.
Effect of starvation on the expression of BdCht2. The day 2 third-instar larvae were fed or starved for 24 and 48 h before collection. The re-feeding larvae were starved for 24 h first and, then, re-fed for an additional 24 h before collection. F, feeding; S, starvation; RF, re-feeding. Different letters above each bar indicate significant difference (ANOVA, DMRT, p < 0.05). The error bars represent the means and standard errors of three replicates.

