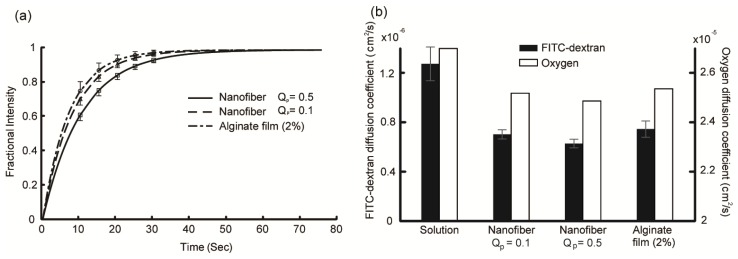
Figure 2.
Results of fluorescence recovery after photobleaching (FRAP) measurements. (a) Fractional fluorescence intensity recovery curves at flow rates of 0.5 and 0.1 mL/h electrospun line patterns and the 2% calcium alginate hydrogel. Error bars represent the standard deviations; (b) Diffusion coefficients of 3-kDa FITC-dextran and oxygen in the electrospun line patterns, 2% calcium alginate hydrogel, and water at 37 °C. Oxygen diffusion coefficients are estimated values from Equation 2 and the diffusion coefficient of 3-kDa FITC-dextran. Error bars represent the standard deviations.

