
Figure 2.
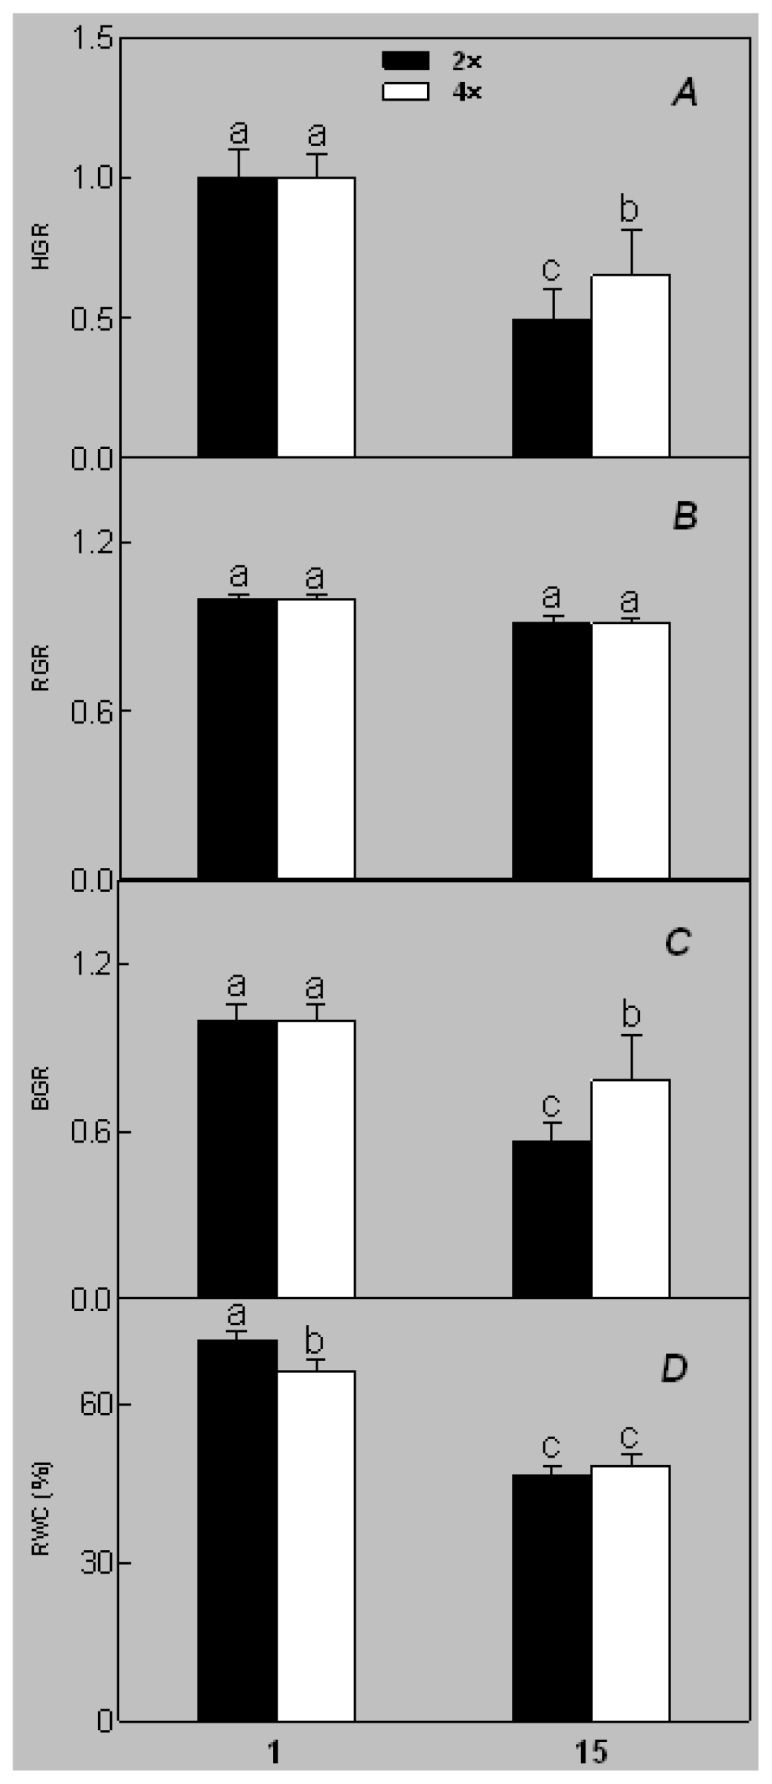
Effects of salt stress on relative height growth rate (HGR) (A), relative range growth rate (RGR) (B), relative basal diameter growth rate (BGR) (C), and relative water content (RWC) (D) of leaves in Robinia pseudoacacia diploid (2×) (black bars) and tetraploid (4×) (white bars) plants growing under salt stress. Values followed by different letters are significantly different from each other at p < 0.05 according to Duncan’s method. Each data point represents the mean ± standard error of three replicates.