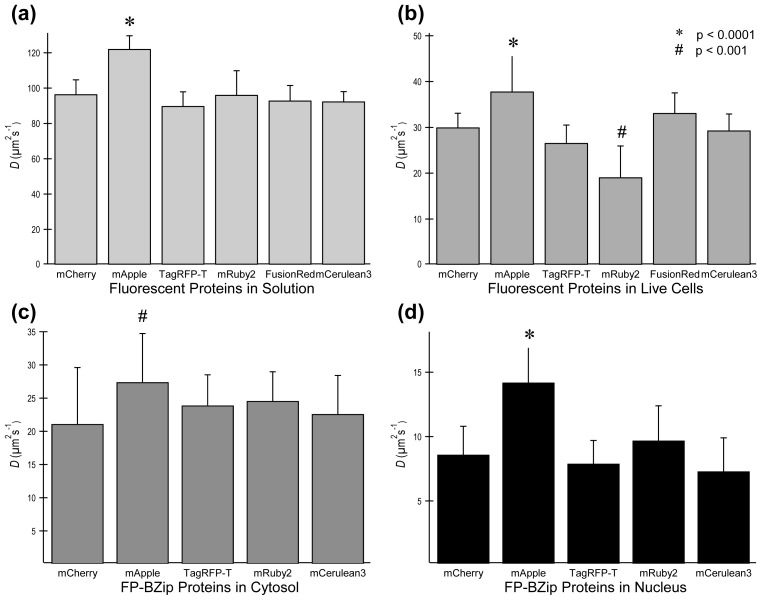
Figure 3.
Diffusion coefficient (D) determined by FCS at optimal excitation intensities (see Table 1). (a) Ds for purified FPs in solution are all statistically the same, except for mApple, which has no flickering threshold and shows an apparent D 30% > than D for other FPs; (b) D for FPs determined in cytosol at optimal excitation intensities. The apparent D for mApple-BZip is significantly (*) higher than the other FP-fusion proteins. D for mRuby2 is significantly (#) lower than the other FPs; (c) D for FP-BZip fusion proteins determined in the cytosol. The apparent D for mApple-BZip is significantly (#) higher than the other FP-BZip fusion proteins; (d) D for FP-BZip fusion proteins in the nucleus (away from heterochromatin) is much slower than in the cytosol due to BZip interactions with DNA. Apparent D for mApple=BZip is significantly (*) higher. Significance determined by comparing each red FP against values found for mCerulean3 in solution and in live cells for multiple T tests using the Holm-Sidak method (* p < 0.001, # p < 0.0001).

