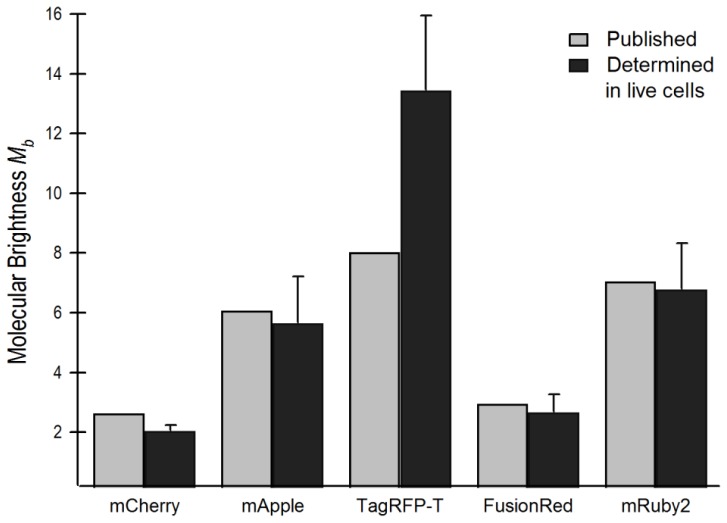
Figure 5.
Experimentally determined molecular brightness, Mb, of red FPs in live cells compared with published intrinsic brightness values normalized by a scalar factor (see text). Mb values for all FPs except mApple were found using one-component autocorrelation curves to determine concentration, (see text for discussion of determination of Mb for mApple).

