
Figure 7.
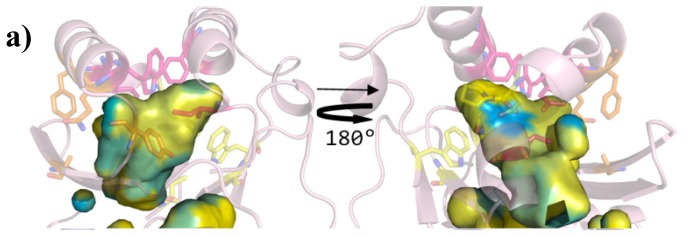

Lipophilic potential of the ligand-binding sites of the QS LuxR and of the prototype of the PAB LuxR solos subfamily. (a) TraR (PDB_ID 1H0M [24]) in light pink (showing the side chains of the conserved core in yellow, of the specificity patch in magenta and of the variable patch in orange); (b) SdiA (PDB_ID 2AVX [30]) in light blue; (c) LasR (PDB_ID 3IX3) in light orange; (d) CviR (PDB_ID 3QP1 [29]) in light green; (e) QscR (PDB_ID 3SZT [28]) in light yellow; (f) OryR model in blue purple. The hydrophobic surface is indicated by yellow and the hydrophilic surface by cyan. Left column: top view (same orientation of the previous Figures); Right column: bottom view (obtained by 180 degrees rotation around y axis). Figures produced by Pymol [33].