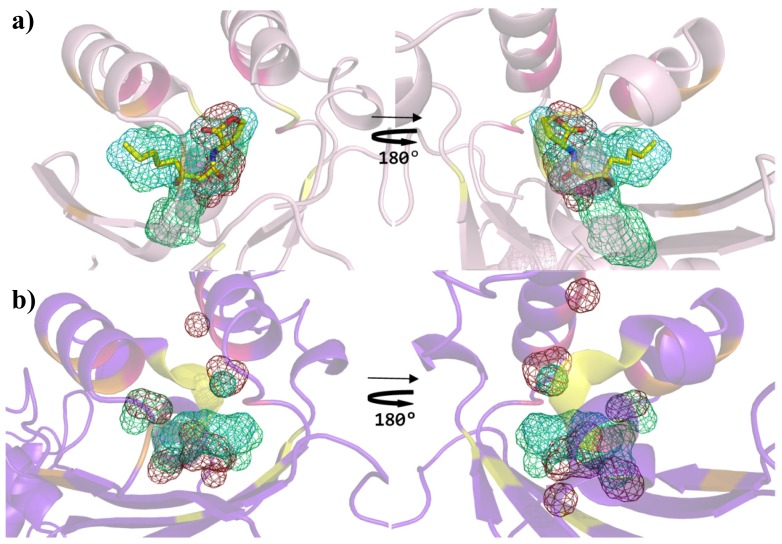
Figure 8.
Comparison of the binding site preferences of prototypes of QS LuxRs and of PAB LuxR solos subfamily. Cartoon diagram (a) of TraR X-ray crystal structure in complex with OC8-HSL (PDB_ID 1H0M [24]) (showing the Cα trace of the conserved core in yellow, of the specificity patch in magenta and of the variable patch in orange) and (b) of the model of OryR, showing the top ranking clusters obtained by SITEHOUND [37] as mesh: methyl carbon probe clusters (green), aromatic carbon probe clusters (cyan) and hydroxyl oxygen probe cluster (red). The carbon, nitrogen and oxygen atoms of OC8-HSL are colored in yellow, blue and red respectively. Left column: top view of the ligand binding sites (same orientation as in previous figures); right column: bottom view (obtained by 180 degree rotation around y axis). Figures produced by Pymol [33].

