Figure 4.
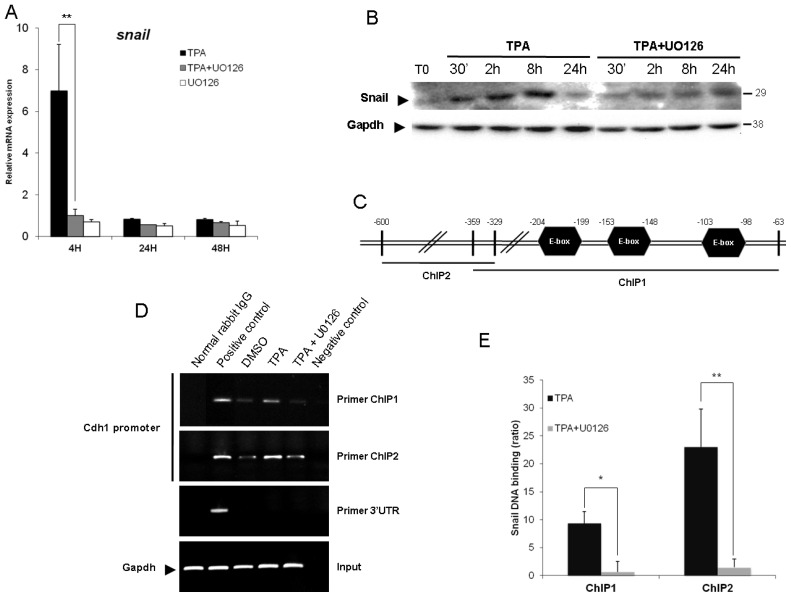
The binding of Snail to the E-box of the CDH1 promoter requires ERK1/2 activation. (A) Levels of Snail mRNA were assessed by real-time RT-PCR. The HepG2 cells were stimulated with 100 nM TPA, with or without U0126, for 4 h, 24 h and 48 h. Relative mRNA expression levels (with respect to gapdh) were determined, with the mRNA levels in DMSO-treated cells set to 1; (B) Total proteins were extracted after 30 min, 2 h, 8 h and 24 h and the expression level of Snail was examined by western blotting. As a control, the same membranes were also probed with an antibody directed against Gapdh; (C) Diagram of the CDH1 promoter showing the amplification site used for ChIP analyses; (D) HepG2 cells were exposed for 4 h to 100 nM TPA with or without U0126. Rabbit anti-Snail, normal rabbit IgG (negative control) and mouse anti-RNA Pol II (positive control) antibodies were used for immunoprecipitation. Input DNA, together with immunoprecipitated and purified DNA, was used for the amplification by PCR of a 296 bp (ChIP1) or a 271 bp (ChIP2) fragment specific to the CDH1 promoter; (E) Band intensities were assessed by densitometry after image acquisition with a CCD camera and the results are presented as the ratio between the value for treated cells to that for DMSO-treated cells, both these values being normalized according to input (means ± SD for three experiments). The data presented are representative of three independent experiments. * p < 0.05; ** p < 0.01.

