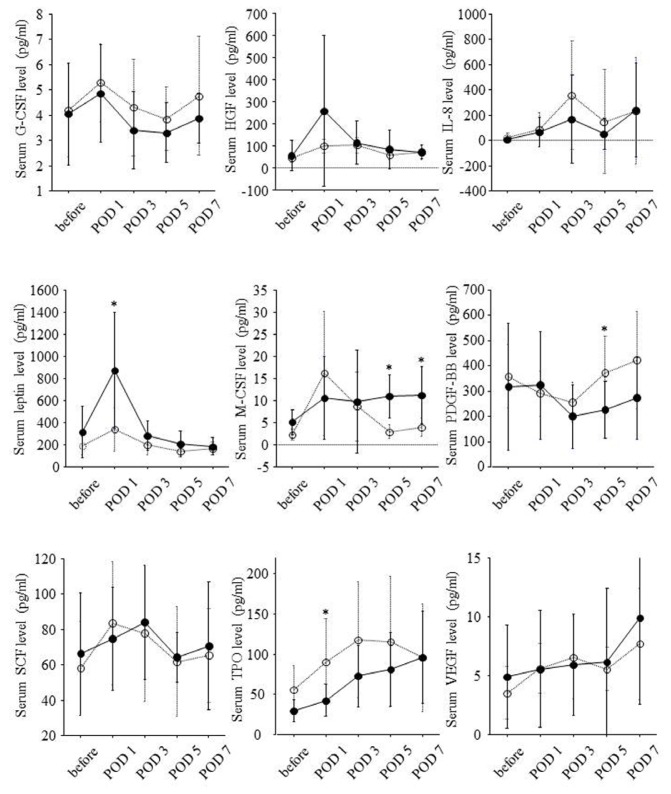
Figure 6.
Associations of liver regeneration with serial changes of serum levels of nine growth factors during the clinical course. Solid and dotted lines show serial changes of serum levels of each growth factor in eight patients showing ratio of liver volume on POD 14 to liver volume on POD 0 of 150% or higher and the other eight patients showing this ratio <150%, respectively. Serum levels of each growth factor before hepatectomy and on POD 1, 3, 5 and 7 were expressed as mean ± standard deviation. Before: before partial hepatectomy; POD: postoperative day; *: p < 0.05.

