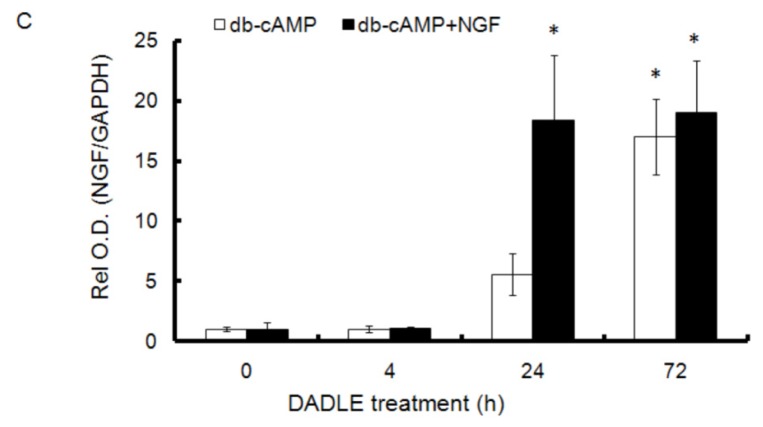
Figure 2.

RT-PCR analysis of NGF expression in F11 cells. F11 cells were differentiated with 0.5 mM db-cAMP and with or without 50 ng/mL NGF for 72 h. DADLE (1 μM) was treated for varied times. After 72 h the total RNA was extracted and semi-quantitative RT-PCR was carried out. (A) Induction of NGF mRNA after 72 h DADLE treatment in F11 cells differentiated only in the presence of db-cAMP; (B) Induction of NGF mRNA after 72 h DADLE treatment in F11 cells differentiated in the presence of db-cAMP and NGF; (C) Data are expressed as mean ± SEM of three independent experiments. Relative optical density (Rel O.D.) of the NGF RT-PCR DNA band to that of the respective GAPDH band was normalized with Rel O.D. of the untreated control (DADLE treatment for 0 h) assigned to be unit one. * p < 0.05.

