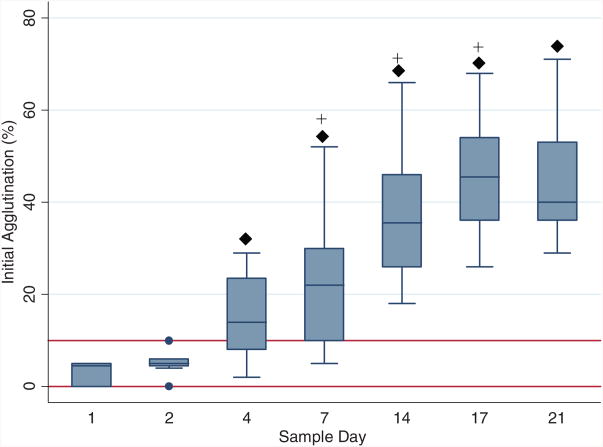
Fig. 5.
Box plots of initial agglutination percentages by sample day shown as median, 25th, and 75th percentiles. Normal initial agglutination percentages are indicated by solid horizontal lines. (◆) Values differ from baseline (Day 1), p < 0.05; (+) values differ from previous measurement day, p < 0.05.

