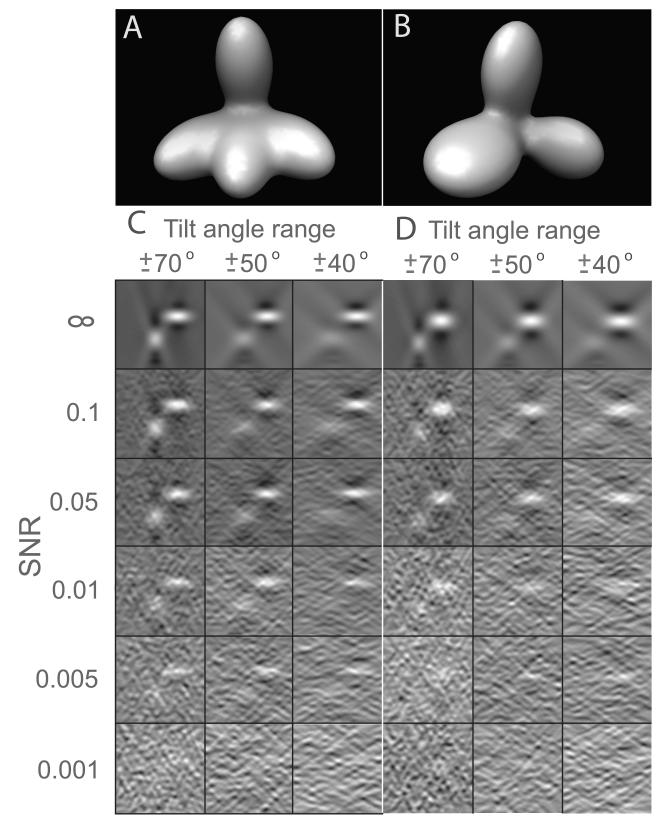
Figure 3.
Tomograms of phantom models simulated at various signal-to-noise ratios (SNR) and tilt angles ranges. Tomograms are of size 643 voxels. (A) Isosurface of model 1 consisting of four Gaussian functions of the same shape. The principal axis of three Gaussian functions are in the same plane, while the principal axis of the fourth Gaussian function is positioned orthogonal to the first three Gaussian functions. (B) Isosurface of model 2 consisting of three Gaussian functions with different intensity distributions. (C) Slices taken along direction through the tomograms at different levels of noise and tilt angle ranges. The Isosurface is plotted using the Chimera software (Pettersen et al., 2004).

