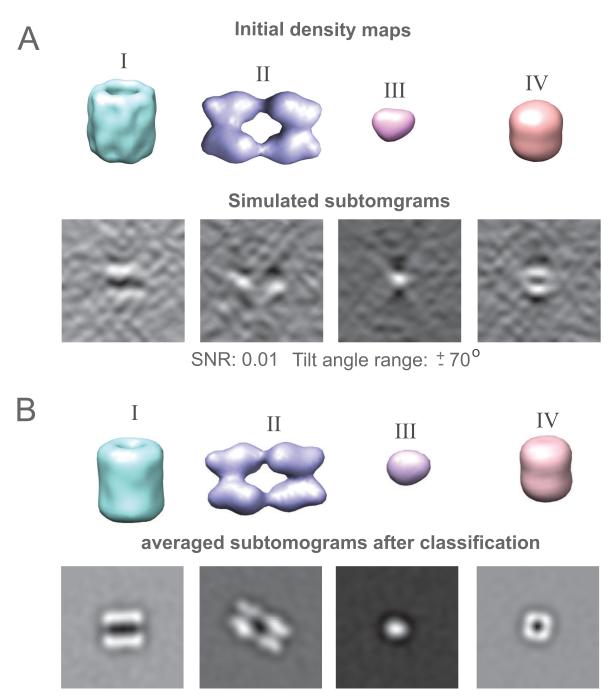
Figure 4.
Reference-free subtomogram classification for simulated subtomograms from 4 different protein complexes. (A) Density map of selected protein complexes (I: GroEL (PDBID: 1KP8), II: Carboamoyl phosphate synthase (PDBID: 1BXR), III: octameric enolase (PDBID: 1W6T), IV: ClpP (PDBID: 1YG6 )) and a slice of a simulated subtomogram generated for SNR 0.01 and a tilt angle range ±60. The slice is taken along the y direction. (B) Density maps of complexes generated by averaging all the classified and aligned subtomograms in each class. Also shown is though the averaged tomograms .

